
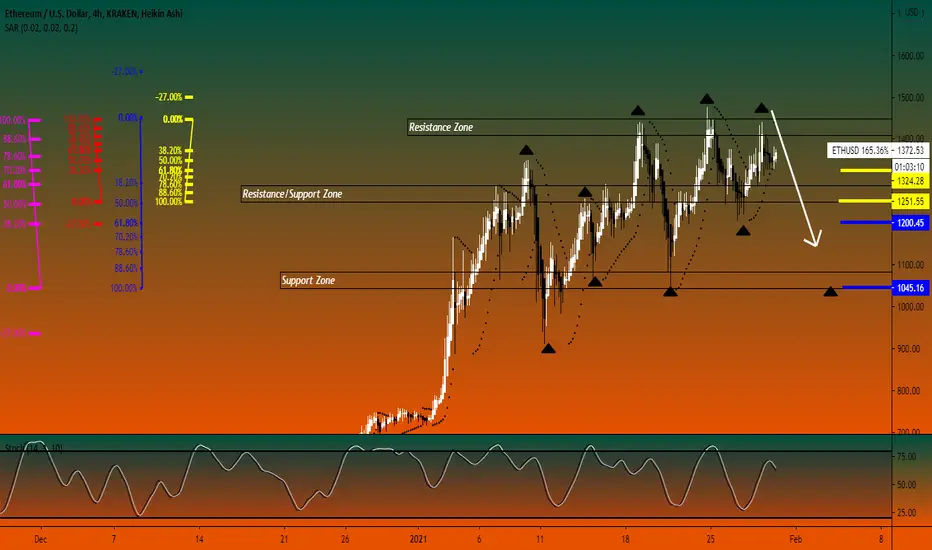
Downtrend Fibonacci's:
Yellow Fib: Resistance Zone to R/S Zone
Blue Fib: Resistance Zone to Support Zone
Uptrend Fibonacci's:
Red Fib: R/S Zone to Resistance Zone
Cyan Fib: Support Zone to Resistance Zone
Analysis:
I think ETH will lose its steam soon. In my eyes, price is currently testing the R/S Zone. The previous high wasn't broken. I believe price will reach the 61.80 to 100% on the Yellow Fib. If lucky, price will proceed to the 61.80/100% marks on the Blue Fib.
I sold because price hit the 61.80/100% zones on both the cyan and the red Fib. Usually price either hits the 61.80 - 100% and retraces the previous trend. On the red Fib, price hit 100% and since it hit, price has been testing the support. I got in a little late but I have a good feeling about this.
Strike Prices:
(1324 - 1045)
Yellow Fib: Resistance Zone to R/S Zone
Blue Fib: Resistance Zone to Support Zone
Uptrend Fibonacci's:
Red Fib: R/S Zone to Resistance Zone
Cyan Fib: Support Zone to Resistance Zone
Analysis:
I think ETH will lose its steam soon. In my eyes, price is currently testing the R/S Zone. The previous high wasn't broken. I believe price will reach the 61.80 to 100% on the Yellow Fib. If lucky, price will proceed to the 61.80/100% marks on the Blue Fib.
I sold because price hit the 61.80/100% zones on both the cyan and the red Fib. Usually price either hits the 61.80 - 100% and retraces the previous trend. On the red Fib, price hit 100% and since it hit, price has been testing the support. I got in a little late but I have a good feeling about this.
Strike Prices:
(1324 - 1045)

Pernyataan Penyangkalan
Informasi dan publikasi ini tidak dimaksudkan, dan bukan merupakan, saran atau rekomendasi keuangan, investasi, trading, atau jenis lainnya yang diberikan atau didukung oleh TradingView. Baca selengkapnya di Ketentuan Penggunaan.
Pernyataan Penyangkalan
Informasi dan publikasi ini tidak dimaksudkan, dan bukan merupakan, saran atau rekomendasi keuangan, investasi, trading, atau jenis lainnya yang diberikan atau didukung oleh TradingView. Baca selengkapnya di Ketentuan Penggunaan.