
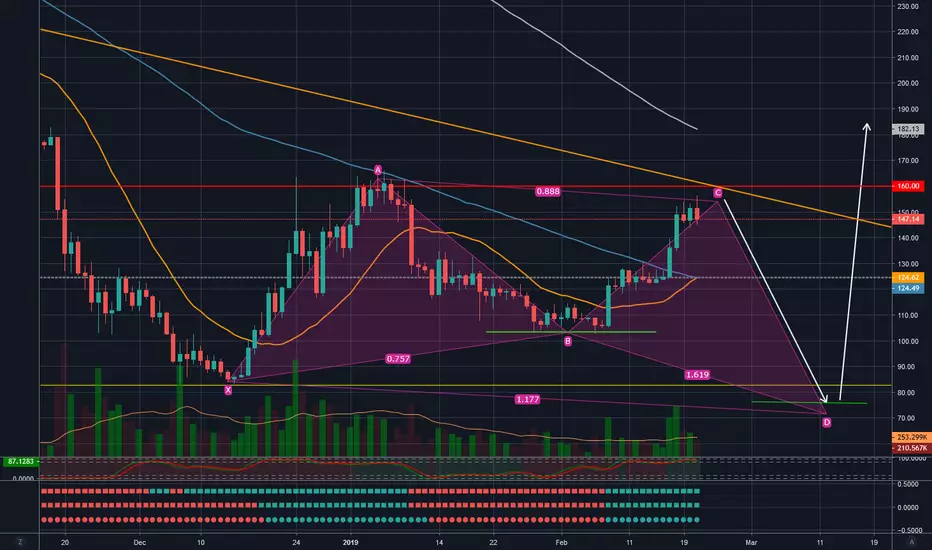
In a previous post, a Bullish Butterfly was developing on the ETH USD Daily Chart at around $103. That pattern still seems to be in play, which may give an indication that if short move down was coming to the recent Bullish Momentum, it would come relatively soon.
The pattern would also indicate a much stronger move in the upcoming months of March and April. I will be watching to see if this pattern plays out and if the $160 and distant downtrend line will act enough resistance to put sellers in play. The pattern seems to qualify, so I will most certainly be interested to see a much stronger move past the distant trend line and points C of the Wing.
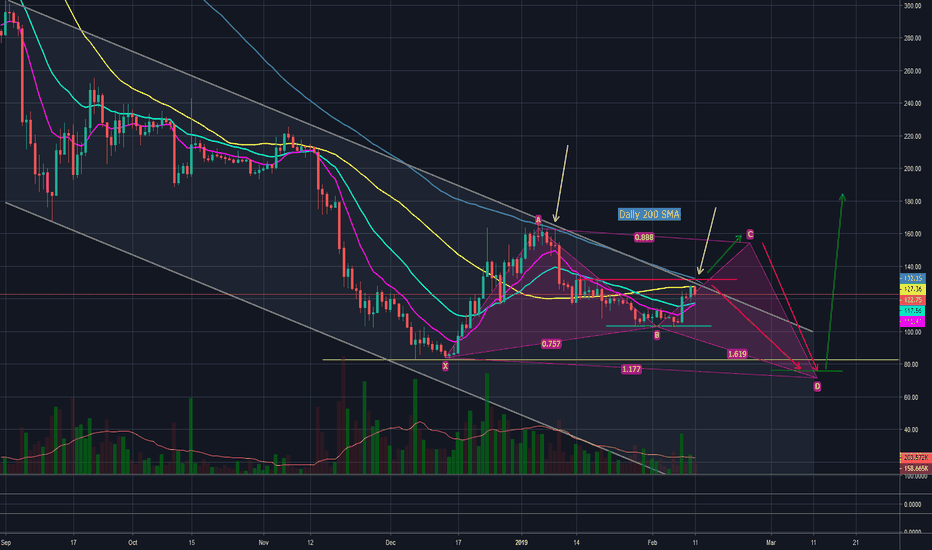
The pattern would also indicate a much stronger move in the upcoming months of March and April. I will be watching to see if this pattern plays out and if the $160 and distant downtrend line will act enough resistance to put sellers in play. The pattern seems to qualify, so I will most certainly be interested to see a much stronger move past the distant trend line and points C of the Wing.
Trade aktif
Recent Bearish activity hasn't yet broken the minor uptrend line, but the Bullish Butterfly has yet to be invalidated. I anticipate this to move down to the marked area, and then possibly farther down. 
Pernyataan Penyangkalan
Informasi dan publikasi ini tidak dimaksudkan, dan bukan merupakan, saran atau rekomendasi keuangan, investasi, trading, atau jenis lainnya yang diberikan atau didukung oleh TradingView. Baca selengkapnya di Ketentuan Penggunaan.
Pernyataan Penyangkalan
Informasi dan publikasi ini tidak dimaksudkan, dan bukan merupakan, saran atau rekomendasi keuangan, investasi, trading, atau jenis lainnya yang diberikan atau didukung oleh TradingView. Baca selengkapnya di Ketentuan Penggunaan.