
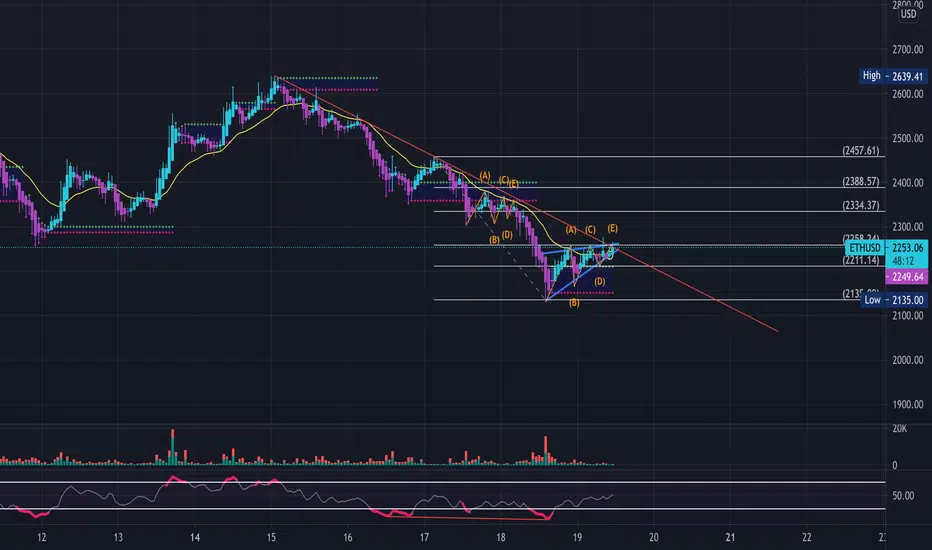
ETH sitting right on its 20day EMA at the moment and approaching the end of another rising wedge ( bearish )- See Previous Charts
- Following an ABCDE pattern from the previous rising wedge it broke below
- Bearish divergence on the RSI
- Expecting further downside, watching for a long-term entry circa/sub $2,000
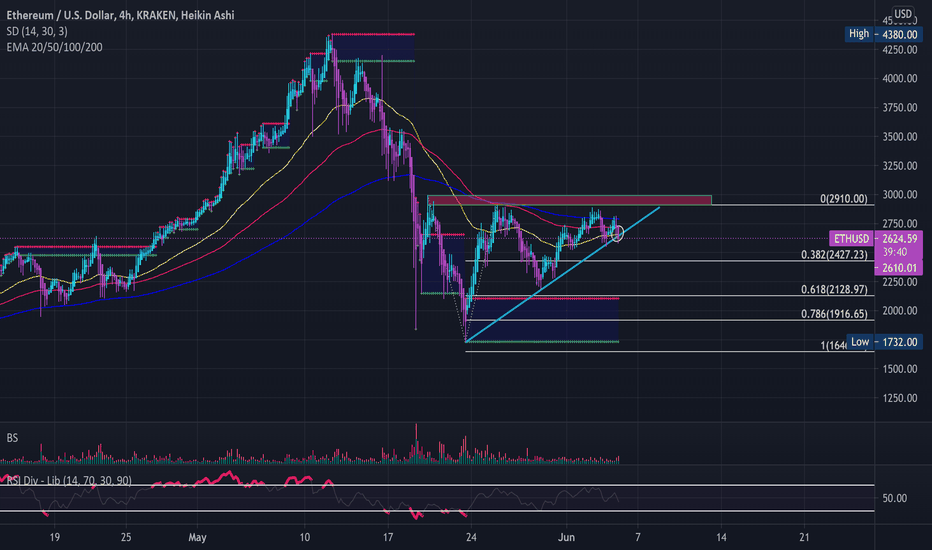
ETH forming a symmetrical triangle- will be watching closely to see which way it breaks for possible long entries.
- Buyer volume is drying up and bearish divergence on the RSI
- Bearish Gartley formed on the 30-minute timeframe
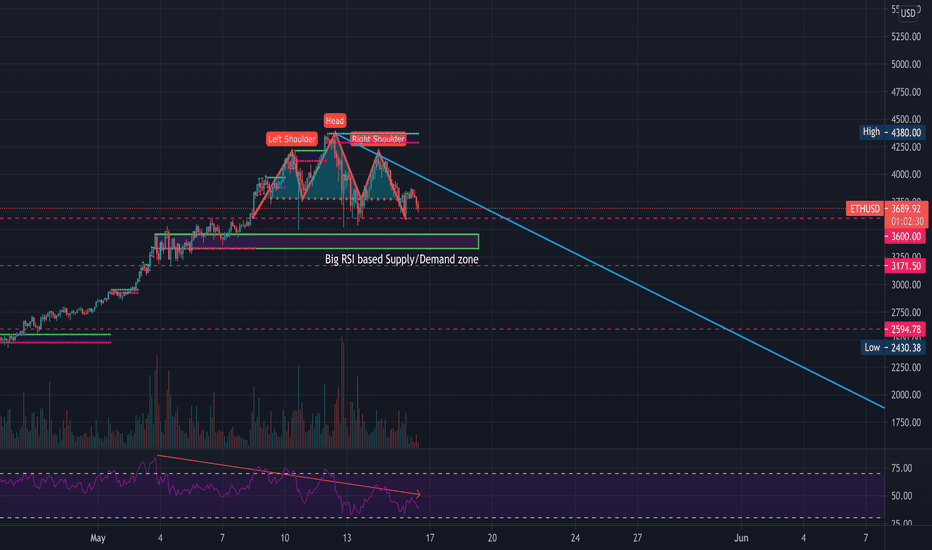
- Following an ABCDE pattern from the previous rising wedge it broke below
- Bearish divergence on the RSI
- Expecting further downside, watching for a long-term entry circa/sub $2,000
ETH forming a symmetrical triangle- will be watching closely to see which way it breaks for possible long entries.
- Buyer volume is drying up and bearish divergence on the RSI
- Bearish Gartley formed on the 30-minute timeframe

Pernyataan Penyangkalan
Informasi dan publikasi ini tidak dimaksudkan, dan bukan merupakan, saran atau rekomendasi keuangan, investasi, trading, atau jenis lainnya yang diberikan atau didukung oleh TradingView. Baca selengkapnya di Ketentuan Penggunaan.
Pernyataan Penyangkalan
Informasi dan publikasi ini tidak dimaksudkan, dan bukan merupakan, saran atau rekomendasi keuangan, investasi, trading, atau jenis lainnya yang diberikan atau didukung oleh TradingView. Baca selengkapnya di Ketentuan Penggunaan.