
ETHUSD: Bullish Butterfly at HOP with RSI and MACD Recovering
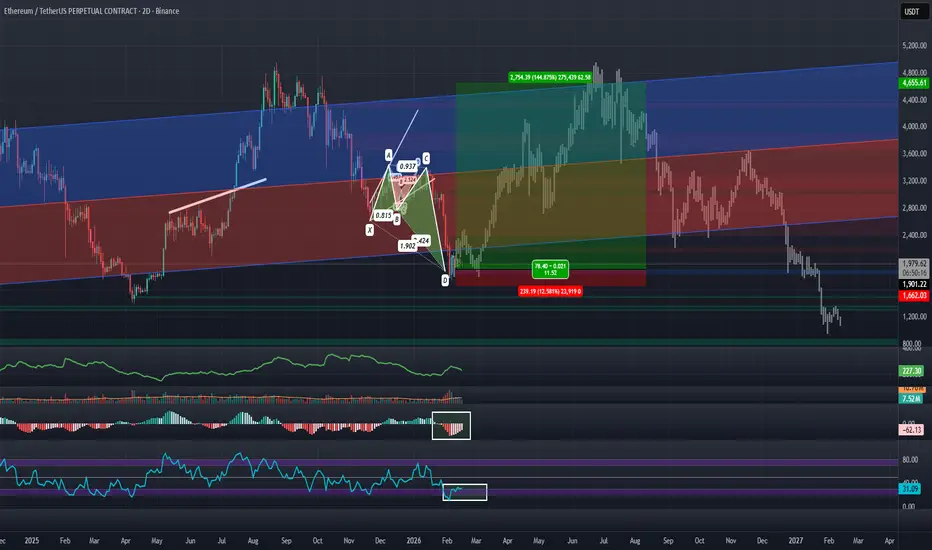
Previously I shorted ETH via puts on the Grayscale ETHE ETF seen here:  But I will now be taking profit on those shorts and looking to long ETH back up to around the mid-top lines of the linear regression channel. I will be doing so off the back of a Bullish Butterfly that has developed on the daily paired with the waning of negative momentum in the MACD, RSI, and what appears to be the start of a decline in the ATR. I think this butterfly can carry us to the line of best fit around $3,400 but could very well extend out to the very top of the channel around $4,600; this movement would likely be in alignment with BTC pushing back towards the $80k-106k zones as I have speculated it will do here: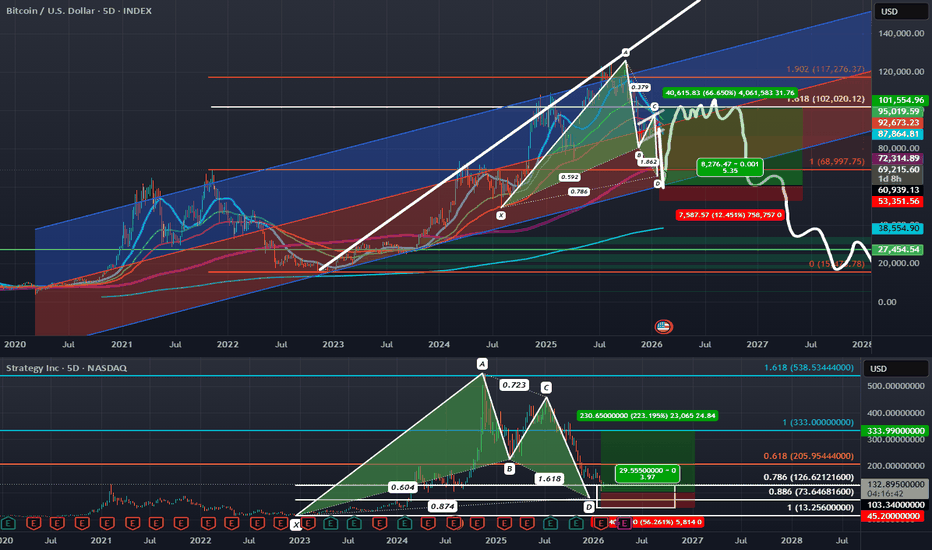
From these Bullish Target Zones I will then look for signs to Take profit and short again from which I suspect both ETH and BTC will begin their path to making significantly lower multi-year lows.
From these Bullish Target Zones I will then look for signs to Take profit and short again from which I suspect both ETH and BTC will begin their path to making significantly lower multi-year lows.
Trade aktif
Catatan
The bigger setup has been confirmed by the lower timeframe as seen in this new post below: 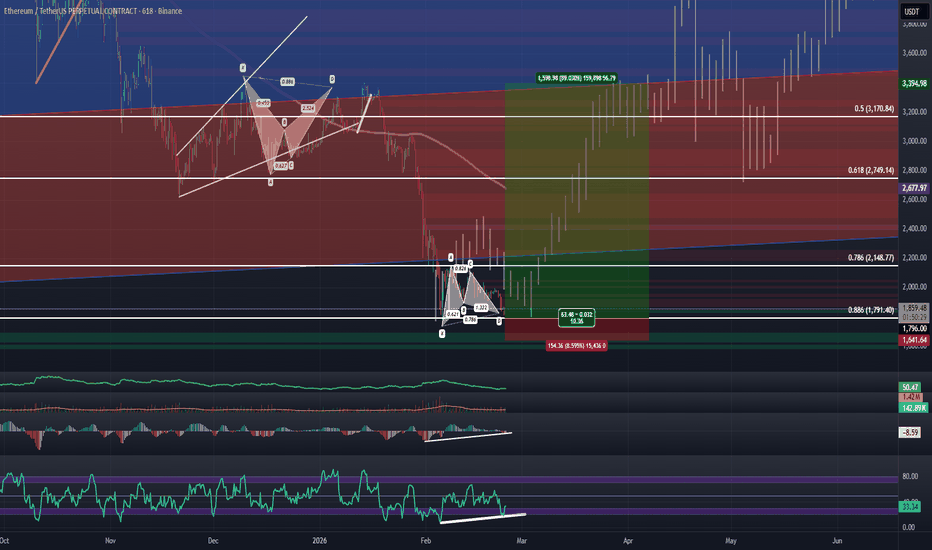

Publikasi terkait
Pernyataan Penyangkalan
Informasi dan publikasi ini tidak dimaksudkan, dan bukan merupakan, saran atau rekomendasi keuangan, investasi, trading, atau jenis lainnya yang diberikan atau didukung oleh TradingView. Baca selengkapnya di Ketentuan Penggunaan.
Publikasi terkait
Pernyataan Penyangkalan
Informasi dan publikasi ini tidak dimaksudkan, dan bukan merupakan, saran atau rekomendasi keuangan, investasi, trading, atau jenis lainnya yang diberikan atau didukung oleh TradingView. Baca selengkapnya di Ketentuan Penggunaan.