
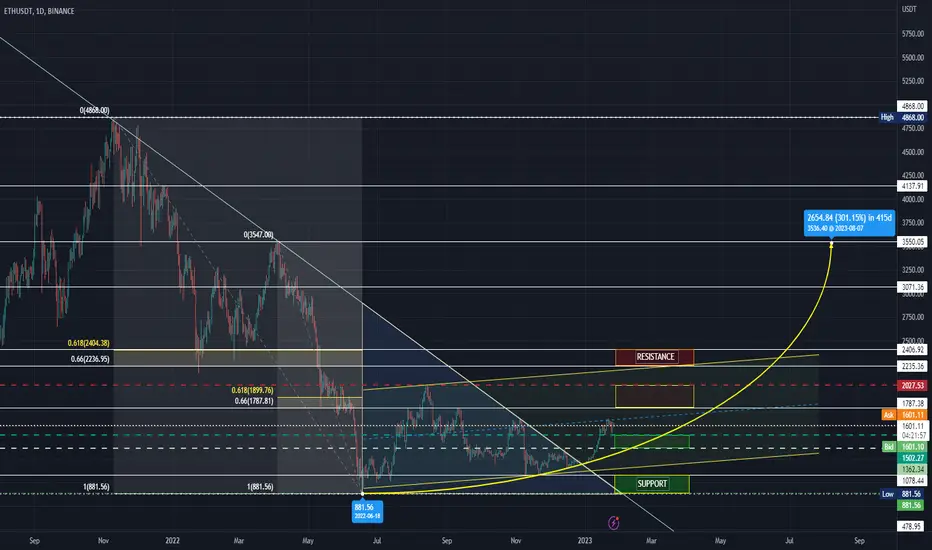
ETH/USDT Binance
1D hollow candlesticks
As the bear market is over, we can say a few things for the price movement of altcoins.
A descending triangle has been formed, as the price already breakout this triangle.
Also, a parallel uptrend channel has been formed since the beginning of June 2022.
A first resistance area occurred from the extension of the first Fibonacci retracement.
A second main resistance area is a result of the extension of a second Fibonacci retracement.
A forecast indicator shows a possible price movement for the next months.
Ethereum Price (ETH) = $1,600.92 +2.85%
= 0.06945 BTC +1.25%
Market Cap: $1,048,131,057,077
24h Vol: $65,909,497,233
Dominance: BTC: 42.4%
ETH: 18.7%
Good Luck
#CryptoHellas Team

Pernyataan Penyangkalan
Informasi dan publikasi ini tidak dimaksudkan, dan bukan merupakan, saran atau rekomendasi keuangan, investasi, trading, atau jenis lainnya yang diberikan atau didukung oleh TradingView. Baca selengkapnya di Ketentuan Penggunaan.
Pernyataan Penyangkalan
Informasi dan publikasi ini tidak dimaksudkan, dan bukan merupakan, saran atau rekomendasi keuangan, investasi, trading, atau jenis lainnya yang diberikan atau didukung oleh TradingView. Baca selengkapnya di Ketentuan Penggunaan.