
Based on the Ethereum (ETH/USDT) chart you've shared, here is a concise trading strategy:
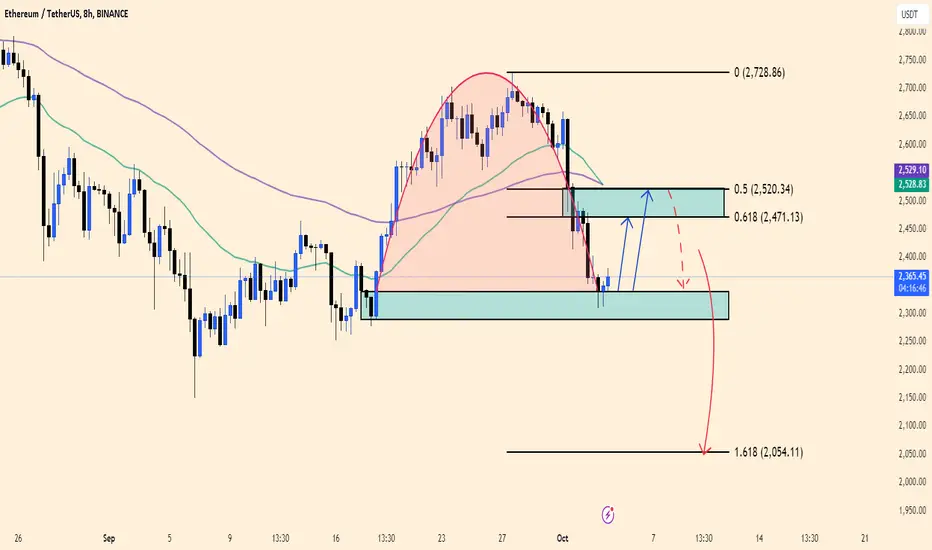
Support Zone: The price is currently testing a key support zone around $2,350. This area has shown buying interest in the past.
Short-Term Bullish Scenario: If the price holds above this support, a potential short-term bullish move could occur, with targets at the Fibonacci retracement levels of $2,471 (0.618) and $2,520 (0.5). Watch for bullish signals in this area to confirm potential upward movement.
Bearish Scenario: If the price fails to hold this support zone, a deeper decline could follow, with a major target at the 1.618 Fibonacci extension level, around $2,054.
Trading Plan: Consider entering a long position if the price bounces off the support zone with confirmation. Set a stop-loss below the support zone. Alternatively, if the price breaks below the support, look for a short opportunity with a target near $2,054.
This strategy provides a balanced approach for both potential bullish and bearish moves.
Support Zone: The price is currently testing a key support zone around $2,350. This area has shown buying interest in the past.
Short-Term Bullish Scenario: If the price holds above this support, a potential short-term bullish move could occur, with targets at the Fibonacci retracement levels of $2,471 (0.618) and $2,520 (0.5). Watch for bullish signals in this area to confirm potential upward movement.
Bearish Scenario: If the price fails to hold this support zone, a deeper decline could follow, with a major target at the 1.618 Fibonacci extension level, around $2,054.
Trading Plan: Consider entering a long position if the price bounces off the support zone with confirmation. Set a stop-loss below the support zone. Alternatively, if the price breaks below the support, look for a short opportunity with a target near $2,054.
This strategy provides a balanced approach for both potential bullish and bearish moves.
Trade aktif
.
Publikasi terkait
Pernyataan Penyangkalan
Informasi dan publikasi ini tidak dimaksudkan, dan bukan merupakan, saran atau rekomendasi keuangan, investasi, trading, atau jenis lainnya yang diberikan atau didukung oleh TradingView. Baca selengkapnya di Ketentuan Penggunaan.
Publikasi terkait
Pernyataan Penyangkalan
Informasi dan publikasi ini tidak dimaksudkan, dan bukan merupakan, saran atau rekomendasi keuangan, investasi, trading, atau jenis lainnya yang diberikan atau didukung oleh TradingView. Baca selengkapnya di Ketentuan Penggunaan.