
Ethereum Analysis
Ethereum Falling Wedge Analysis 🔥🔥🔥
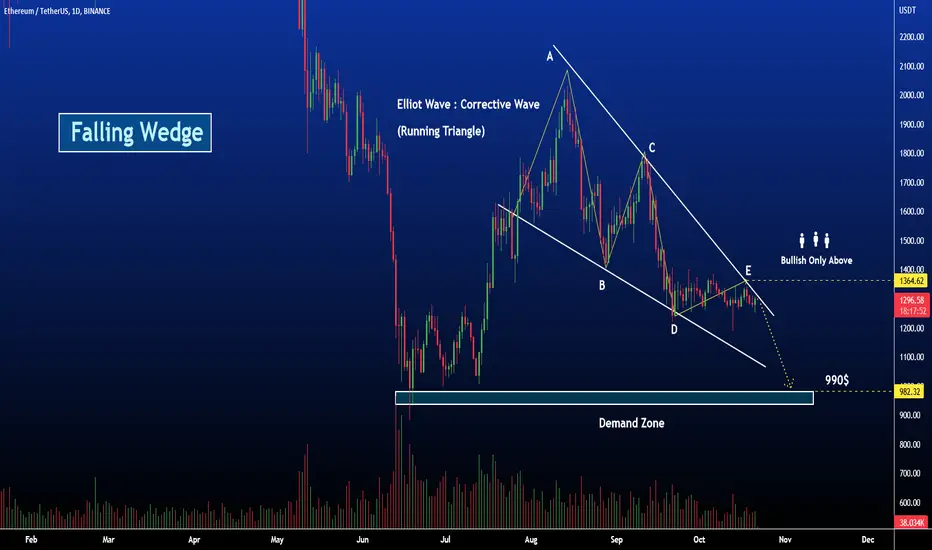
The above chart of Ethereum laid out a Falling Wedge pattern. In a falling wedge pattern, both the upper trend line which connects the highs and the lower trend line which connects the lows converge downwards. The wedge pattern in general indicates a trend reversal. Especially, the falling wedge signals a bullish reversal. This pattern indicates a breakout in the price trend towards an upswing. From the above chart, we can interpret that the momentum of the downtrend is slowing down.
Ethereum is currently trading around $1296. If the pattern broke through the resistance, the price of Ethereum might reach the resistance levels of $1800. If the trend reverses, then the price of Ethereum may fall to $990
Elliot Wave : Corrective Wave (Running Triangle)
Triangle is the third kind of corrective structure , Made up of Five Wave : A,B,C,D & E. It follows a 3-3-3-3-3 wave structure . All waves sub divide into 3 sub waves. Waves B usually overshoots the origin of wave A

So as per the wave structure we may see fall in the Ethereum till 990 $
Happy Trading
Ethereum Falling Wedge Analysis 🔥🔥🔥
The above chart of Ethereum laid out a Falling Wedge pattern. In a falling wedge pattern, both the upper trend line which connects the highs and the lower trend line which connects the lows converge downwards. The wedge pattern in general indicates a trend reversal. Especially, the falling wedge signals a bullish reversal. This pattern indicates a breakout in the price trend towards an upswing. From the above chart, we can interpret that the momentum of the downtrend is slowing down.
Ethereum is currently trading around $1296. If the pattern broke through the resistance, the price of Ethereum might reach the resistance levels of $1800. If the trend reverses, then the price of Ethereum may fall to $990
Elliot Wave : Corrective Wave (Running Triangle)
Triangle is the third kind of corrective structure , Made up of Five Wave : A,B,C,D & E. It follows a 3-3-3-3-3 wave structure . All waves sub divide into 3 sub waves. Waves B usually overshoots the origin of wave A
So as per the wave structure we may see fall in the Ethereum till 990 $
Happy Trading
Trade aktif
Trade aktif
Catatan
Pattern breakout
Publikasi terkait
Pernyataan Penyangkalan
Informasi dan publikasi ini tidak dimaksudkan, dan bukan merupakan, saran atau rekomendasi keuangan, investasi, trading, atau jenis lainnya yang diberikan atau didukung oleh TradingView. Baca selengkapnya di Ketentuan Penggunaan.
Publikasi terkait
Pernyataan Penyangkalan
Informasi dan publikasi ini tidak dimaksudkan, dan bukan merupakan, saran atau rekomendasi keuangan, investasi, trading, atau jenis lainnya yang diberikan atau didukung oleh TradingView. Baca selengkapnya di Ketentuan Penggunaan.