

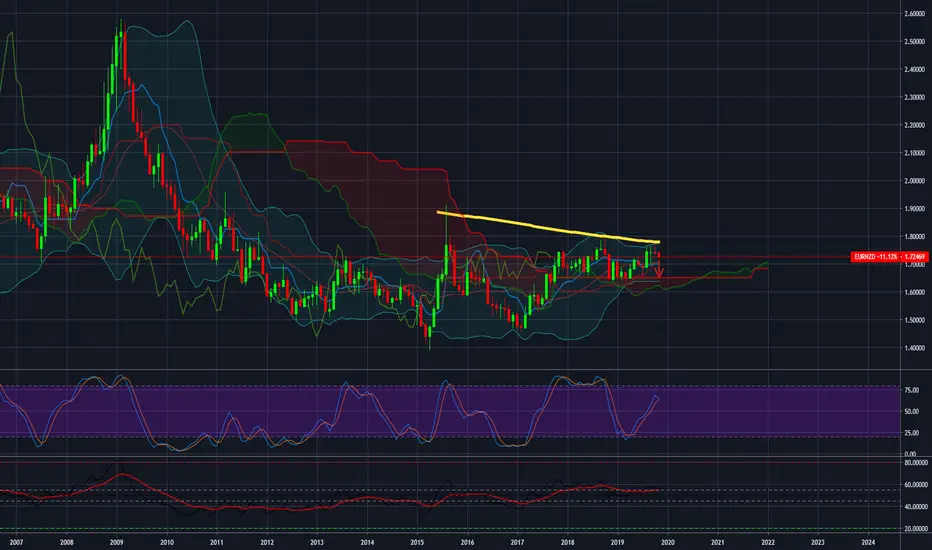
We usually prefer to analyze graphs in D1 but this pattern in the monthly graph forces us to write about it.
2 Doji candlestick symbolizing a trend ending (to confirm the current candle theory should close in red ... got off to a good start)
The 200 moving average line synchronizes with the resistance line at 1.7760.
This is the third time eurnzd has touched the average line and is responding to declines.
Target: 1.7110
2 Doji candlestick symbolizing a trend ending (to confirm the current candle theory should close in red ... got off to a good start)
The 200 moving average line synchronizes with the resistance line at 1.7760.
This is the third time eurnzd has touched the average line and is responding to declines.
Target: 1.7110

Pernyataan Penyangkalan
Informasi dan publikasi ini tidak dimaksudkan, dan bukan merupakan, saran atau rekomendasi keuangan, investasi, trading, atau jenis lainnya yang diberikan atau didukung oleh TradingView. Baca selengkapnya di Ketentuan Penggunaan.
Pernyataan Penyangkalan
Informasi dan publikasi ini tidak dimaksudkan, dan bukan merupakan, saran atau rekomendasi keuangan, investasi, trading, atau jenis lainnya yang diberikan atau didukung oleh TradingView. Baca selengkapnya di Ketentuan Penggunaan.