

Market Context
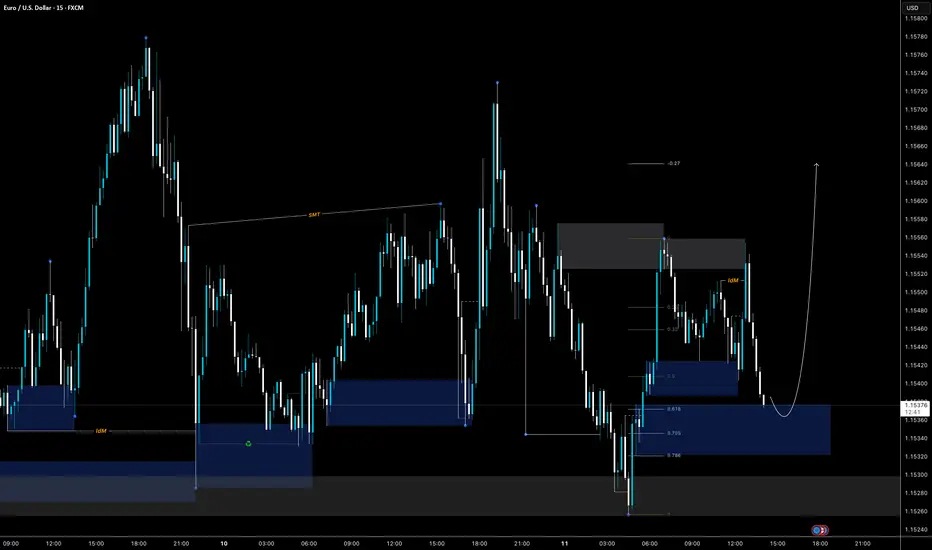
Price has recently delivered a bearish displacement into a discount area after taking sell-side liquidity below the previous intraday lows.
The current price action is forming a potential bullish reaction zone, where institutional accumulation may occur before continuation higher.
SMC Framework
1. Sell-Side Liquidity Sweep
Price swept the sell-side liquidity resting below the previous lows around the 1.1525–1.1530 region.
This liquidity grab created the fuel required for a potential bullish expansion.
The sweep was followed by:
Strong bullish displacement
Change in short-term order flow
Creation of a bullish imbalance/FVG
This suggests smart money may have accumulated long positions after clearing weak hands.
2. Bullish Order Block / Demand Zone
The highlighted blue zone represents the institutional demand area.
This zone aligns with:
Previous bullish displacement origin
Discount pricing
Unmitigated demand
Liquidity reaction area
The idea is that price returns into this zone to rebalance inefficiencies before continuing higher.
OTE (Optimal Trade Entry) Logic
Using the recent impulsive bullish leg:
Premium zone → upside expansion area
Discount zone → accumulation area
The current retracement is approaching the 0.618–0.786 Fibonacci retracement area, which represents the ICT OTE zone.
Reason:
0.618–0.786 retracement alignment
Discount pricing
Previous demand
Liquidity resting below
Standard Deviation Analysis
Price is currently trading near the lower statistical boundary of the recent range.
The deviation framework suggests:
Price has expanded downward beyond the mean
Selling pressure reached an extreme deviation
Mean reversion probability increases from these extremes
The lower deviation band acts as a potential institutional re-accumulation area.
The expectation:
Deviation extreme → return toward mean → expansion toward upper deviation
Price has recently delivered a bearish displacement into a discount area after taking sell-side liquidity below the previous intraday lows.
The current price action is forming a potential bullish reaction zone, where institutional accumulation may occur before continuation higher.
SMC Framework
1. Sell-Side Liquidity Sweep
Price swept the sell-side liquidity resting below the previous lows around the 1.1525–1.1530 region.
This liquidity grab created the fuel required for a potential bullish expansion.
The sweep was followed by:
Strong bullish displacement
Change in short-term order flow
Creation of a bullish imbalance/FVG
This suggests smart money may have accumulated long positions after clearing weak hands.
2. Bullish Order Block / Demand Zone
The highlighted blue zone represents the institutional demand area.
This zone aligns with:
Previous bullish displacement origin
Discount pricing
Unmitigated demand
Liquidity reaction area
The idea is that price returns into this zone to rebalance inefficiencies before continuing higher.
OTE (Optimal Trade Entry) Logic
Using the recent impulsive bullish leg:
Premium zone → upside expansion area
Discount zone → accumulation area
The current retracement is approaching the 0.618–0.786 Fibonacci retracement area, which represents the ICT OTE zone.
Reason:
0.618–0.786 retracement alignment
Discount pricing
Previous demand
Liquidity resting below
Standard Deviation Analysis
Price is currently trading near the lower statistical boundary of the recent range.
The deviation framework suggests:
Price has expanded downward beyond the mean
Selling pressure reached an extreme deviation
Mean reversion probability increases from these extremes
The lower deviation band acts as a potential institutional re-accumulation area.
The expectation:
Deviation extreme → return toward mean → expansion toward upper deviation
Trading ditutup: stop tercapai

Pernyataan Penyangkalan
Informasi dan publikasi ini tidak dimaksudkan, dan bukan merupakan, saran atau rekomendasi keuangan, investasi, trading, atau jenis lainnya yang diberikan atau didukung oleh TradingView. Baca selengkapnya di Ketentuan Penggunaan.
Pernyataan Penyangkalan
Informasi dan publikasi ini tidak dimaksudkan, dan bukan merupakan, saran atau rekomendasi keuangan, investasi, trading, atau jenis lainnya yang diberikan atau didukung oleh TradingView. Baca selengkapnya di Ketentuan Penggunaan.