Two $FSR opportunities same chart
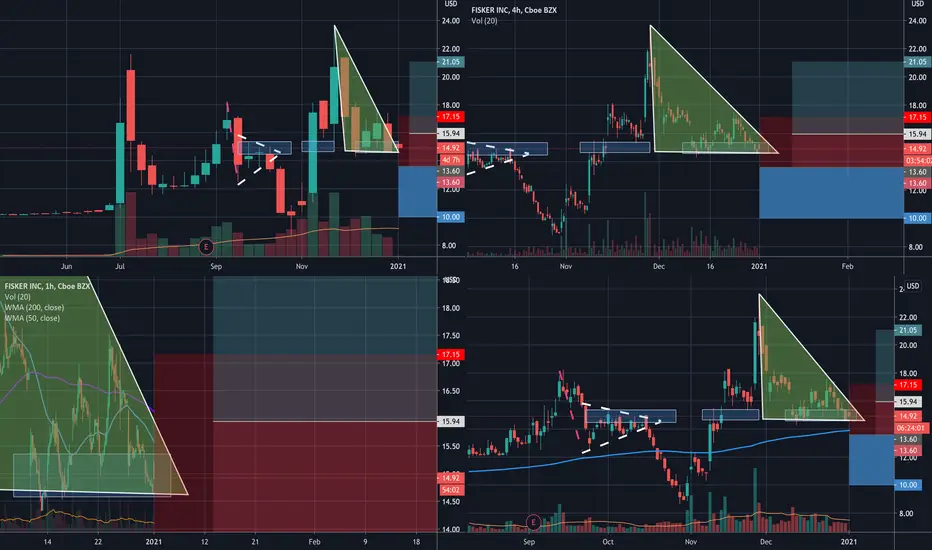
This is what I meant when I say anticipate your opponent.
This chart shows two opposite opportunities. Technically speaking it has a descending triangle which is a bearish pattern. However, as you may notice when price is at $14.50-15.50 range it tends to stall and play around that area. There is better R:R for the long opportunity. For a stock position, waiting on this one and letting price action decide which opportunity to take.
This chart shows two opposite opportunities. Technically speaking it has a descending triangle which is a bearish pattern. However, as you may notice when price is at $14.50-15.50 range it tends to stall and play around that area. There is better R:R for the long opportunity. For a stock position, waiting on this one and letting price action decide which opportunity to take.

Pernyataan Penyangkalan
Informasi dan publikasi ini tidak dimaksudkan, dan bukan merupakan, saran atau rekomendasi keuangan, investasi, trading, atau jenis lainnya yang diberikan atau didukung oleh TradingView. Baca selengkapnya di Ketentuan Penggunaan.
Pernyataan Penyangkalan
Informasi dan publikasi ini tidak dimaksudkan, dan bukan merupakan, saran atau rekomendasi keuangan, investasi, trading, atau jenis lainnya yang diberikan atau didukung oleh TradingView. Baca selengkapnya di Ketentuan Penggunaan.