Fantom Daily Analysis
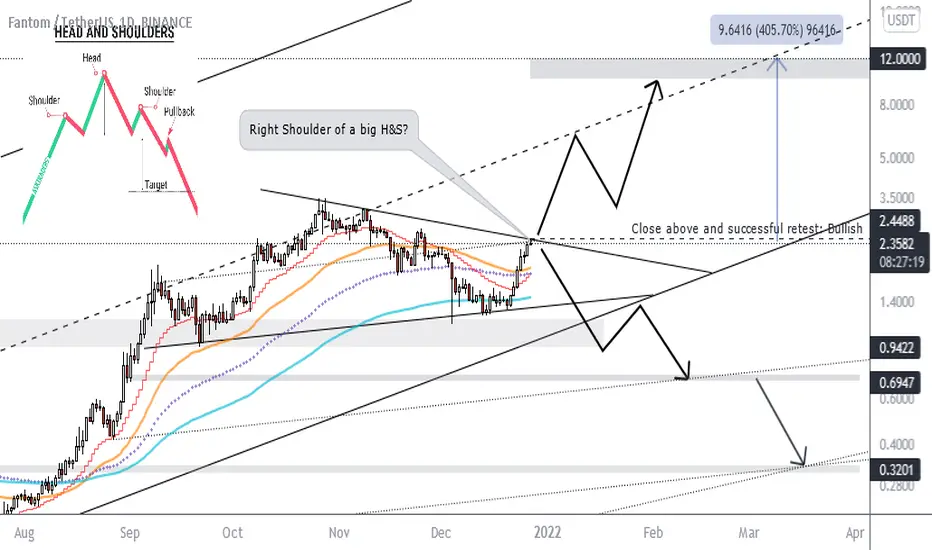
FTM is at the resistance of a triangle and the most important level to determine if it's going to be bullish or bearish. If a daily candle closes above 2.4488 the higher target at $12 is reachable. In another scenario if this level gets rejected the right shoulder of a head and shoulders pattern will be formed and in case of losing the support at $1.4 next supports to hold the price are 0.94, 0.69 and 0.32.

Publikasi terkait
Pernyataan Penyangkalan
Informasi dan publikasi ini tidak dimaksudkan, dan bukan merupakan, saran atau rekomendasi keuangan, investasi, trading, atau jenis lainnya yang diberikan atau didukung oleh TradingView. Baca selengkapnya di Ketentuan Penggunaan.
Publikasi terkait
Pernyataan Penyangkalan
Informasi dan publikasi ini tidak dimaksudkan, dan bukan merupakan, saran atau rekomendasi keuangan, investasi, trading, atau jenis lainnya yang diberikan atau didukung oleh TradingView. Baca selengkapnya di Ketentuan Penggunaan.