
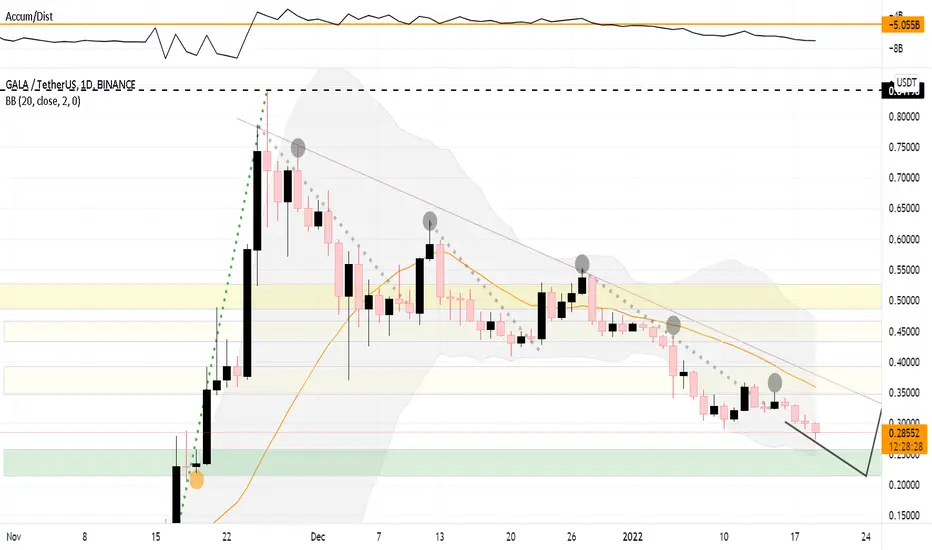
The green zone highlighted should be the ideal Buy range - IMO.
The chart looks pretty typical.
It might get further down by 5 to 10% to reach the Major Bullish range., where the volume needs to pick up
above the Orange Line.
The Trend line looks to be the major resistance for the structure to break out.
The chart turns bullish either :
1. Volume picks up accumulating in Green Zone.
2. Breaks Resistance zones shown in Yellow.
The Chart turns further bearish either :
1. Breaks further down the Green Buy Zone
2. Further drops in Volume.
Not a financial advice
DYOR.
Happy trading

Pernyataan Penyangkalan
Informasi dan publikasi ini tidak dimaksudkan, dan bukan merupakan, saran atau rekomendasi keuangan, investasi, trading, atau jenis lainnya yang diberikan atau didukung oleh TradingView. Baca selengkapnya di Ketentuan Penggunaan.
Pernyataan Penyangkalan
Informasi dan publikasi ini tidak dimaksudkan, dan bukan merupakan, saran atau rekomendasi keuangan, investasi, trading, atau jenis lainnya yang diberikan atau didukung oleh TradingView. Baca selengkapnya di Ketentuan Penggunaan.