

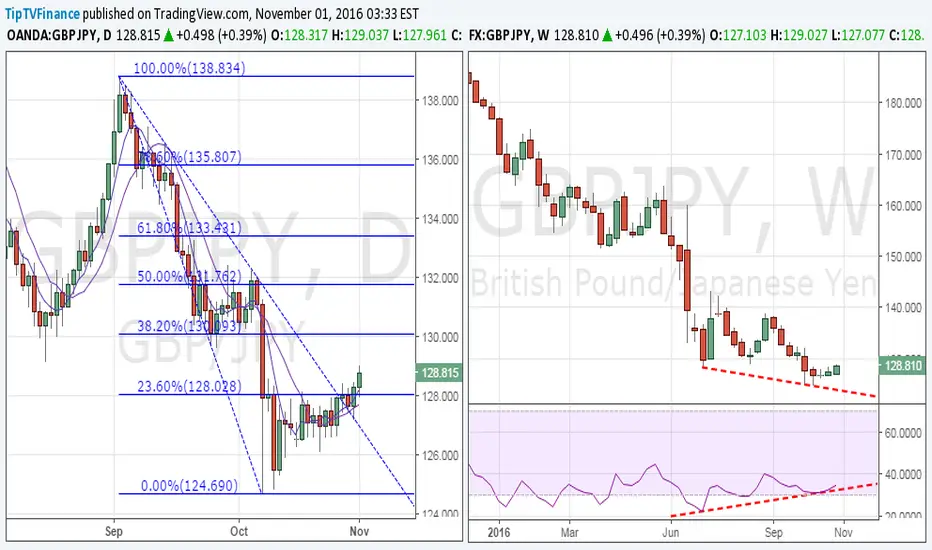
Daily/Weekly chart
· The pair finally closed above 128.03 (23.6% Fibo of Sept high and Oct low) after having repeated failed to do so last month. Also note the bullish 5-DMA and 10-DMA crossover.
· On the weekly chart, we have a bullish price RSI divergence. Consequently, the cross looks poised for a rise to 130.10 (38.2% Fibo).
· On the other hand, only a daily close below 127.19 (previous day’s low) would signal bullish invalidation.
· The pair finally closed above 128.03 (23.6% Fibo of Sept high and Oct low) after having repeated failed to do so last month. Also note the bullish 5-DMA and 10-DMA crossover.
· On the weekly chart, we have a bullish price RSI divergence. Consequently, the cross looks poised for a rise to 130.10 (38.2% Fibo).
· On the other hand, only a daily close below 127.19 (previous day’s low) would signal bullish invalidation.

Pernyataan Penyangkalan
Informasi dan publikasi ini tidak dimaksudkan, dan bukan merupakan, saran atau rekomendasi keuangan, investasi, trading, atau jenis lainnya yang diberikan atau didukung oleh TradingView. Baca selengkapnya di Ketentuan Penggunaan.
Pernyataan Penyangkalan
Informasi dan publikasi ini tidak dimaksudkan, dan bukan merupakan, saran atau rekomendasi keuangan, investasi, trading, atau jenis lainnya yang diberikan atau didukung oleh TradingView. Baca selengkapnya di Ketentuan Penggunaan.