

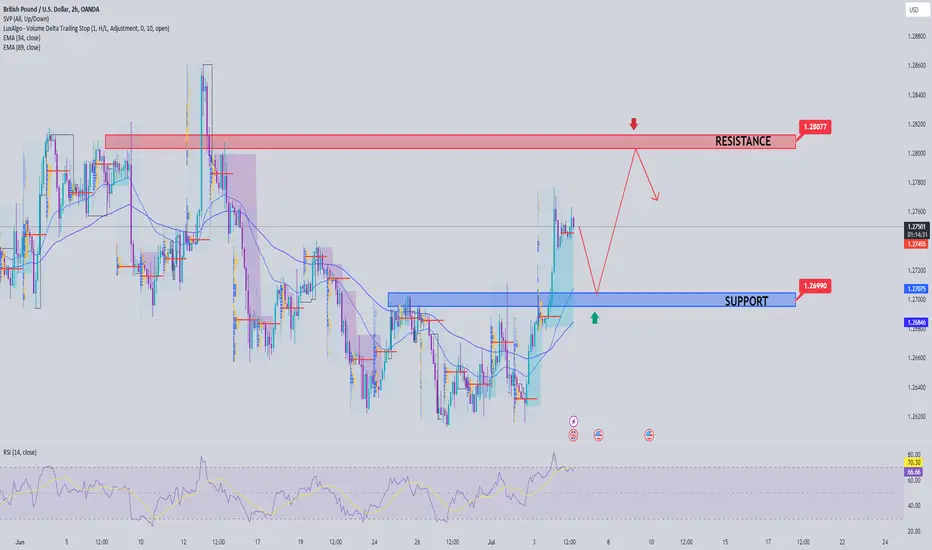
GBP/USD hovers around 1.2750 on UK election day
GBP/USD is trading sideways near 1.2750 during the European session on Thursday. A generally weaker US dollar helped the pair maintain its upward momentum but traders did not place further bets on the British Pound as British voters went to the polls.
The Relative Strength Index (RSI) on the 4-hour chart has risen above 60, reflecting accumulating bullish momentum. Additionally, the last 4-hour candle closed above the 100-period Simple Moving Average.
On the positive side, the 20-day Simple Moving Average (SMA) and 200-period Simple Moving Average (SMA) on the 4-hour chart form strong resistance near 1.2700. In case GBP/USD rises above this level and begins to use it as support, technical buyers may remain interested. In this scenario, 1.2750 (static level) and 1.2800 (static level, psychological level) can be considered as the next resistance.
If GBP/USD fails to break above 1.2700, it could trigger a technical correction. The 100-day SMA links to key support at 1.2640 ahead of 1.2600 (psychological level, static level).
Trading signals
BUY GBPUSD zone 1.27000-1.26800
↠ Stoploss 1.06700
→ Take Profit 1 1.27500
→ Take Profit 2 1.28000
SELL GBPUSD zone 1.28000-1.28200
↠ Stoploss 1.28300
→ Take Profit 1 1.27700
→ Take Profit 2 1.27000
GBP/USD is trading sideways near 1.2750 during the European session on Thursday. A generally weaker US dollar helped the pair maintain its upward momentum but traders did not place further bets on the British Pound as British voters went to the polls.
The Relative Strength Index (RSI) on the 4-hour chart has risen above 60, reflecting accumulating bullish momentum. Additionally, the last 4-hour candle closed above the 100-period Simple Moving Average.
On the positive side, the 20-day Simple Moving Average (SMA) and 200-period Simple Moving Average (SMA) on the 4-hour chart form strong resistance near 1.2700. In case GBP/USD rises above this level and begins to use it as support, technical buyers may remain interested. In this scenario, 1.2750 (static level) and 1.2800 (static level, psychological level) can be considered as the next resistance.
If GBP/USD fails to break above 1.2700, it could trigger a technical correction. The 100-day SMA links to key support at 1.2640 ahead of 1.2600 (psychological level, static level).
Trading signals
BUY GBPUSD zone 1.27000-1.26800
↠ Stoploss 1.06700
→ Take Profit 1 1.27500
→ Take Profit 2 1.28000
SELL GBPUSD zone 1.28000-1.28200
↠ Stoploss 1.28300
→ Take Profit 1 1.27700
→ Take Profit 2 1.27000
Trade aktif

JOIN OUR FREE TELEGRAM GROUP t.me/tvstrading
MESSAGE US FOR VIP SIGNALS🏆 t.me/Leilani8597
MESSAGE US FOR VIP SIGNALS🏆 t.me/Leilani8597
Pernyataan Penyangkalan
Informasi dan publikasi ini tidak dimaksudkan, dan bukan merupakan, saran atau rekomendasi keuangan, investasi, trading, atau jenis lainnya yang diberikan atau didukung oleh TradingView. Baca selengkapnya di Ketentuan Penggunaan.
JOIN OUR FREE TELEGRAM GROUP t.me/tvstrading
MESSAGE US FOR VIP SIGNALS🏆 t.me/Leilani8597
MESSAGE US FOR VIP SIGNALS🏆 t.me/Leilani8597
Pernyataan Penyangkalan
Informasi dan publikasi ini tidak dimaksudkan, dan bukan merupakan, saran atau rekomendasi keuangan, investasi, trading, atau jenis lainnya yang diberikan atau didukung oleh TradingView. Baca selengkapnya di Ketentuan Penggunaan.