

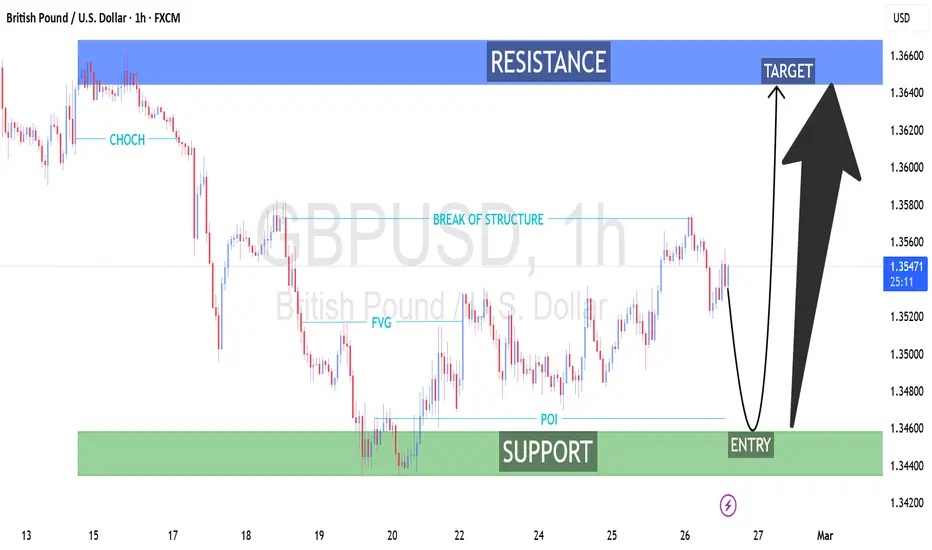
GBP/USD (1H) Technical Analysis
Smart Money Concepts (SMC) Structure-Based Outlook
1. Market Context
On the 1-hour timeframe, GBP/USD is trading within a broader short-term recovery phase after a prior impulsive bearish leg. Price is currently positioned mid-range between a well-defined support zone (demand) and a higher resistance zone (supply).
The chart reflects Smart Money Concepts (SMC) elements including:
CHoCH (Change of Character)
Break of Structure (BOS)
FVG (Fair Value Gap)
POI (Point of Interest)
Clearly defined Support and Resistance zones
2. Structure Analysis
🔹 Early Bearish Phase
A CHoCH signaled the shift from bullish to bearish structure.
This was followed by a strong impulsive sell-off creating a new lower low.
The downside move established a clear bearish order flow.
🔹 Accumulation & Demand Reaction
Price reached a strong support zone (~1.3440–1.3460).
Multiple rejections suggest institutional demand.
This area acts as a higher-timeframe liquidity pool.
🔹 Bullish Break of Structure (BOS)
A subsequent BOS confirmed short-term bullish order flow.
The bullish leg left behind a visible FVG, indicating imbalance.
The POI aligns with discount pricing inside the range.
3. Current Price Position
Price is now:
Retracing from a recent local high (~1.3580 area).
Moving back toward the support zone marked as “ENTRY”.
Potentially completing a corrective pullback before continuation.
This creates a classic pullback-to-demand continuation setup.
4. Trade Scenario Outlook
🟢 Bullish Scenario (Higher Probability Based on Structure)
Pullback into the support/demand zone.
Confirmation via:
Bullish rejection candles
Lower timeframe BOS
Liquidity sweep below support
Target:
Upper resistance zone (~1.3640–1.3660)
Risk-to-reward appears favorable if entry occurs deep in demand.
🔴 Bearish Invalidation
A clean break and sustained close below the support zone.
That would reintroduce bearish continuation toward lower liquidity.
5. Liquidity & Institutional Perspective
Equal highs near resistance suggest buy-side liquidity resting above.
The projected move likely aims to sweep that liquidity.
Market structure currently favors accumulation over distribution.
6. Professional Summary
The 1H structure shows:
Transition from bearish to bullish order flow.
Valid BOS confirming short-term upside bias.
Pullback into demand offering potential continuation entry.
Clear liquidity target at resistance.
Bias: Short-term bullish toward 1.3640–1.3660, provided support holds.
Smart Money Concepts (SMC) Structure-Based Outlook
1. Market Context
On the 1-hour timeframe, GBP/USD is trading within a broader short-term recovery phase after a prior impulsive bearish leg. Price is currently positioned mid-range between a well-defined support zone (demand) and a higher resistance zone (supply).
The chart reflects Smart Money Concepts (SMC) elements including:
CHoCH (Change of Character)
Break of Structure (BOS)
FVG (Fair Value Gap)
POI (Point of Interest)
Clearly defined Support and Resistance zones
2. Structure Analysis
🔹 Early Bearish Phase
A CHoCH signaled the shift from bullish to bearish structure.
This was followed by a strong impulsive sell-off creating a new lower low.
The downside move established a clear bearish order flow.
🔹 Accumulation & Demand Reaction
Price reached a strong support zone (~1.3440–1.3460).
Multiple rejections suggest institutional demand.
This area acts as a higher-timeframe liquidity pool.
🔹 Bullish Break of Structure (BOS)
A subsequent BOS confirmed short-term bullish order flow.
The bullish leg left behind a visible FVG, indicating imbalance.
The POI aligns with discount pricing inside the range.
3. Current Price Position
Price is now:
Retracing from a recent local high (~1.3580 area).
Moving back toward the support zone marked as “ENTRY”.
Potentially completing a corrective pullback before continuation.
This creates a classic pullback-to-demand continuation setup.
4. Trade Scenario Outlook
🟢 Bullish Scenario (Higher Probability Based on Structure)
Pullback into the support/demand zone.
Confirmation via:
Bullish rejection candles
Lower timeframe BOS
Liquidity sweep below support
Target:
Upper resistance zone (~1.3640–1.3660)
Risk-to-reward appears favorable if entry occurs deep in demand.
🔴 Bearish Invalidation
A clean break and sustained close below the support zone.
That would reintroduce bearish continuation toward lower liquidity.
5. Liquidity & Institutional Perspective
Equal highs near resistance suggest buy-side liquidity resting above.
The projected move likely aims to sweep that liquidity.
Market structure currently favors accumulation over distribution.
6. Professional Summary
The 1H structure shows:
Transition from bearish to bullish order flow.
Valid BOS confirming short-term upside bias.
Pullback into demand offering potential continuation entry.
Clear liquidity target at resistance.
Bias: Short-term bullish toward 1.3640–1.3660, provided support holds.

Publikasi terkait
Pernyataan Penyangkalan
Informasi dan publikasi ini tidak dimaksudkan, dan bukan merupakan, saran atau rekomendasi keuangan, investasi, trading, atau jenis lainnya yang diberikan atau didukung oleh TradingView. Baca selengkapnya di Ketentuan Penggunaan.
Publikasi terkait
Pernyataan Penyangkalan
Informasi dan publikasi ini tidak dimaksudkan, dan bukan merupakan, saran atau rekomendasi keuangan, investasi, trading, atau jenis lainnya yang diberikan atau didukung oleh TradingView. Baca selengkapnya di Ketentuan Penggunaan.