
GLD | Gold's Weekly Structure Is Deteriorating — Is Another Major Leg Down Coming?
**Ticker:** AMEX:GLD
**Timeframe:** Weekly (1W)
**Bias:** Bearish — Watching for Support Breakdown
Gold has been under sustained selling pressure, and the weekly chart is beginning to tell a compelling story.
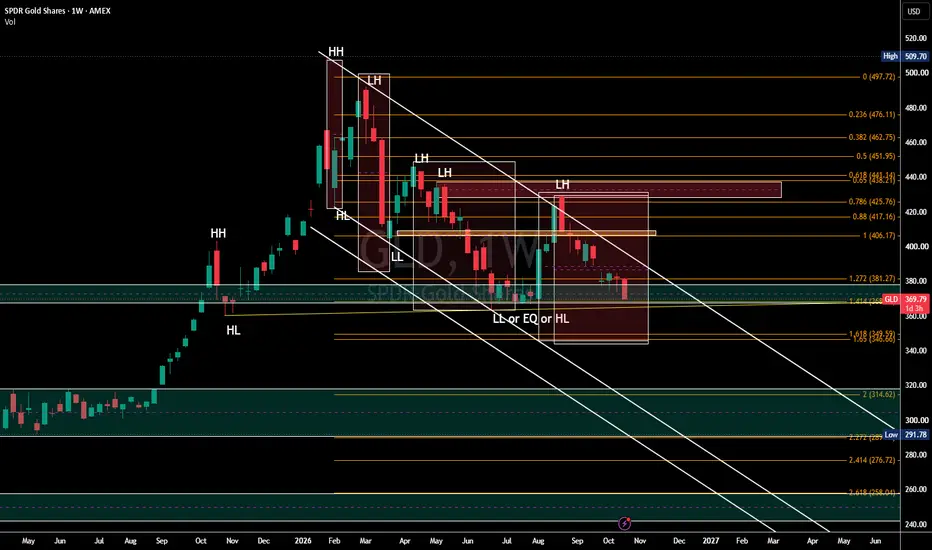
Following its major peak near **$509.70**, GLD has established a sequence of **Lower Highs (LH)**, with price repeatedly failing to reclaim previous supply zones.
The descending trendline continues to act as dynamic resistance, while buyers are struggling to defend the $360–$370 support region.
The key question now: **Are we witnessing a temporary correction, or the beginning of a deeper structural decline in gold?**
### 📉 Technical Structure — Sellers Remain in Control
- **Lower Highs:** Successive rallies have failed to reclaim previous swing highs, indicating weakening bullish momentum.
- **Lower Lows:** The broader correction has produced lower swing lows, although the latest support floor has not yet been decisively broken.
- **Descending Resistance:** Price continues to trade below the major falling trendline.
- **Supply Zones:** The $425–$441 region represents significant overhead resistance.
- **Critical Support:** GLD is testing the $360–$370 demand region.
Until GLD can reclaim its descending resistance structure, rallies should be treated cautiously.
### 🎯 Key GLD Levels to Watch
**Immediate support**
- $369–$370 — Current support test
- $360 — Important horizontal support
- $349.59 — Fibonacci 1.618 extension
- $346.66 — Fibonacci 1.65 extension
**Bearish extension targets**
- $314.62 — Fibonacci 2.0
- $291.78 — Major historical support
- $258.04 — Fibonacci 2.618
**Upside resistance**
- $381.27 — First recovery level
- $406.17 — Major resistance / prior structure
- $425.76 — Fibonacci 0.786
- $438.21–$441.14 — Higher supply / resistance
### 🌎 Macro Perspective — Why Is Gold Under Pressure?
Gold's weakness cannot be explained by chart structure alone.
**1. Higher Treasury Yields**
Elevated U.S. Treasury yields increase the opportunity cost of holding gold, an asset that produces no interest income.
**2. Federal Reserve Policy**
Persistent inflation and uncertainty surrounding additional monetary tightening are challenging gold's near-term outlook. Higher-for-longer interest rates can remain a headwind.
**3. U.S. Dollar Strength**
A stronger dollar generally creates pressure on dollar-denominated gold by making it more expensive for international buyers.
**4. Inflation and Geopolitical Risk**
Inflation and geopolitical uncertainty can support gold as a long-term hedge. However, when inflation leads to expectations of tighter monetary policy and higher real yields, gold can decline even during periods of uncertainty.
**5. Structural Demand**
Central-bank accumulation, investment demand, and diversification away from traditional reserve assets remain potential long-term supports. These forces can coexist with a bearish technical correction.
### 🔴 Bearish Scenario
A confirmed weekly breakdown below **$360** would strengthen the bearish structure and expose:
**$349.59 → $346.66 → $314.62 → $291.78**
The $314.62 region becomes particularly interesting as the 2.0 Fibonacci extension and a potential longer-term reaction area.
### 🟢 Bullish Recovery Scenario
If buyers defend $360–$370, GLD could attempt a relief rally toward:
**$381.27 → $406.17 → $425.76**
A sustained weekly recovery above $406.17 would be an early sign of improving structure. Reclaiming the $425–$441 resistance region would provide stronger evidence that sellers are losing control.
### 📌 Conclusion
**Price structure comes first. Macro provides the context.**
GLD remains technically vulnerable as long as the sequence of lower highs persists.
The $360 region is the immediate battleground. A decisive breakdown may accelerate selling toward the deeper Fibonacci extensions, while a defended support zone could produce a meaningful countertrend recovery.
Gold's long-term investment case may remain intact, but that does not automatically make the current technical structure bullish.
**Trade the structure, not the narrative.**
*This analysis represents market observations and conditional scenarios, not financial advice.*

QuantriumFlow™ · Unified Market Structure Engine
Structure • Delta Zones • Cross-Market Confirmation
Options-flow analytics framework for QQQ, SPY, Futures and beyond.
Join Discord for daily levels: discord.gg/BNdfuAwTAd
Not Financial Advice.
Structure • Delta Zones • Cross-Market Confirmation
Options-flow analytics framework for QQQ, SPY, Futures and beyond.
Join Discord for daily levels: discord.gg/BNdfuAwTAd
Not Financial Advice.
Pernyataan Penyangkalan
Informasi dan publikasi ini tidak dimaksudkan, dan bukan merupakan, saran atau rekomendasi keuangan, investasi, trading, atau jenis lainnya yang diberikan atau didukung oleh TradingView. Baca selengkapnya di Ketentuan Penggunaan.