
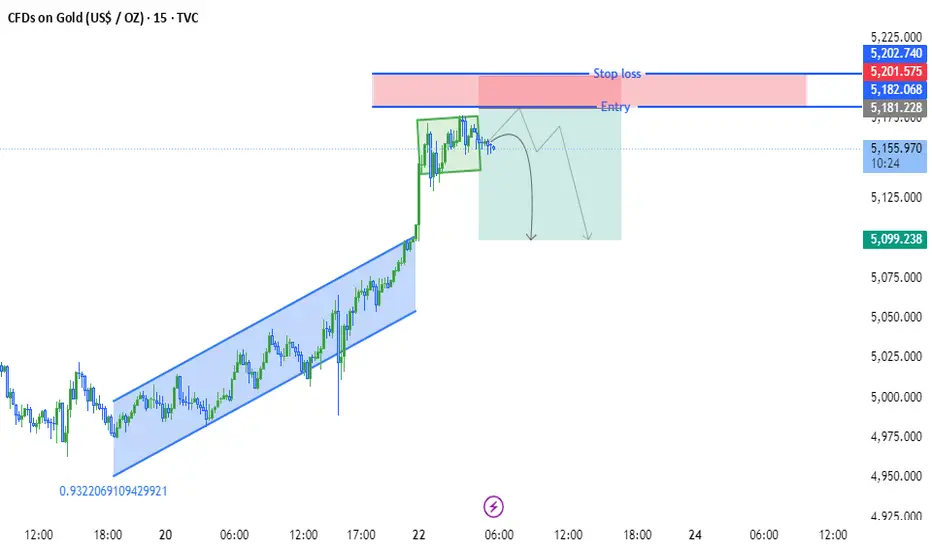
Price advanced inside a well-defined rising channel, then delivered a strong bullish breakout with momentum expansion. That impulse leg is now followed by tight consolidation near the highs — a common transition phase between continuation and reversal.
Current Structure
* Price is compressing in a small range after the breakout.
* Upside momentum is slowing.
* Wicks show rejection near the highs.
* No strong continuation candles yet.
This behavior often signals *distribution or absorption* rather than immediate continuation.
Key Levels
Resistance: ~5,190–5,200 (recent highs / stop liquidity zone)
Range Support: ~5,170
Major Intraday Support ~5,120
Bearish Target Zone:** ~5,100–5,090
These zones align with liquidity pockets and prior imbalance areas.
---
4️⃣ Bearish Scenario (Higher Probability if Breakdown Occurs)
If price breaks below 5,170 with acceptance and momentum:
* Liquidity sweep above highs likely complete
* Acceleration toward 5,120
* Extension toward 5,100–5,090
This would represent a classic:
Impulse → Distribution → Markdow
5️⃣ Bullish Invalidation Scenario
If price:
* Breaks and holds above 5,200
* Prints strong continuation candles
* Shows high-volume expansion
Then structure shifts back to bullish continuation with potential toward 5,220+.
6️⃣ Trade Logic Evaluation
* Risk area clearly defined above range highs
* Strong R:R if targeting prior imbalance
* Best execution comes after confirmed breakdown + retest
Entering inside the range increases fakeout risk.
Overall Bias
Neutral-to-bearish while below 5,200.
Confirmed bearish below 5,170.
Bullish continuation above 5,200.
If you'd like, I can also break this down into:
* Scalper view
* Intraday swing plan
* Liquidity-based smart money perspective
* Probability modeling
Trading ditutup: stop tercapai

Join My Telegram Channel
t.me/+_BCUEbbdrKhkNmJk
t.me/+_BCUEbbdrKhkNmJk
t.me/+_BCUEbbdrKhkNmJk
t.me/+_BCUEbbdrKhkNmJk
Pernyataan Penyangkalan
Informasi dan publikasi ini tidak dimaksudkan, dan bukan merupakan, saran atau rekomendasi keuangan, investasi, trading, atau jenis lainnya yang diberikan atau didukung oleh TradingView. Baca selengkapnya di Ketentuan Penggunaan.