
Gold Price Faces Resistance Near 4,207—Potential Pullback Ahead
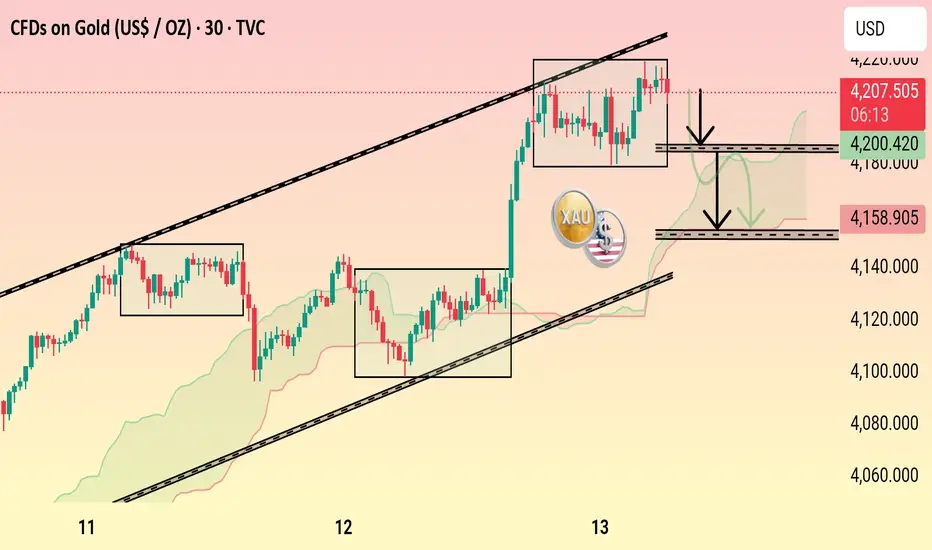
Gold (XAU/USD) is testing the upper channel resistance around 4,207 after a strong rally. The chart suggests a possible short-term correction toward the 4,200–4,158 support zone before the next directional move.
🟡 1. Current Trend
Gold (XAU/USD) is trading in an ascending channel, indicating an overall bullish trend.
Price action has been forming higher highs and higher lows, confirming steady upward momentum.
---
🔴 2. Resistance Zone
The upper boundary of the channel and price level around 4,207 USD is acting as a strong resistance.
The chart shows multiple rejections near this zone, suggesting a potential short-term top or profit-taking area.
---
🟢 3. Support Levels
The first key support is near 4,200 USD, aligning with previous price consolidation.
A deeper correction could test 4,158 USD, which matches the lower channel trendline and Ichimoku support zone.
---
⚫ 4. Price Action Pattern
The boxed consolidations represent sideways accumulation phases before each breakout — a sign of strong buying pressure.
However, the latest consolidation near the channel top hints at buyer fatigue, which could lead to a pullback.
---
🟣 5. Expected Move (Short-Term Outlook)
The downward arrows on the chart suggest a potential retracement within the channel.
Price could dip toward 4,158–4,200 USD before finding fresh buying interest.
As long as price remains above 4,158, the bullish structure remains intact.
---
⚙️ 6. Trading Implications
Aggressive traders: May look for short opportunities near resistance (~4,207) with tight stops above the channel.
Conservative traders: May wait for a bounce confirmation around 4,158–4,200 to rejoin the uptrend.
🟡 1. Current Trend
Gold (XAU/USD) is trading in an ascending channel, indicating an overall bullish trend.
Price action has been forming higher highs and higher lows, confirming steady upward momentum.
---
🔴 2. Resistance Zone
The upper boundary of the channel and price level around 4,207 USD is acting as a strong resistance.
The chart shows multiple rejections near this zone, suggesting a potential short-term top or profit-taking area.
---
🟢 3. Support Levels
The first key support is near 4,200 USD, aligning with previous price consolidation.
A deeper correction could test 4,158 USD, which matches the lower channel trendline and Ichimoku support zone.
---
⚫ 4. Price Action Pattern
The boxed consolidations represent sideways accumulation phases before each breakout — a sign of strong buying pressure.
However, the latest consolidation near the channel top hints at buyer fatigue, which could lead to a pullback.
---
🟣 5. Expected Move (Short-Term Outlook)
The downward arrows on the chart suggest a potential retracement within the channel.
Price could dip toward 4,158–4,200 USD before finding fresh buying interest.
As long as price remains above 4,158, the bullish structure remains intact.
---
⚙️ 6. Trading Implications
Aggressive traders: May look for short opportunities near resistance (~4,207) with tight stops above the channel.
Conservative traders: May wait for a bounce confirmation around 4,158–4,200 to rejoin the uptrend.
Trade aktif
Trading ditutup: target tercapai

Publikasi terkait
Pernyataan Penyangkalan
Informasi dan publikasi ini tidak dimaksudkan, dan bukan merupakan, saran atau rekomendasi keuangan, investasi, trading, atau jenis lainnya yang diberikan atau didukung oleh TradingView. Baca selengkapnya di Ketentuan Penggunaan.
Publikasi terkait
Pernyataan Penyangkalan
Informasi dan publikasi ini tidak dimaksudkan, dan bukan merupakan, saran atau rekomendasi keuangan, investasi, trading, atau jenis lainnya yang diberikan atau didukung oleh TradingView. Baca selengkapnya di Ketentuan Penggunaan.