
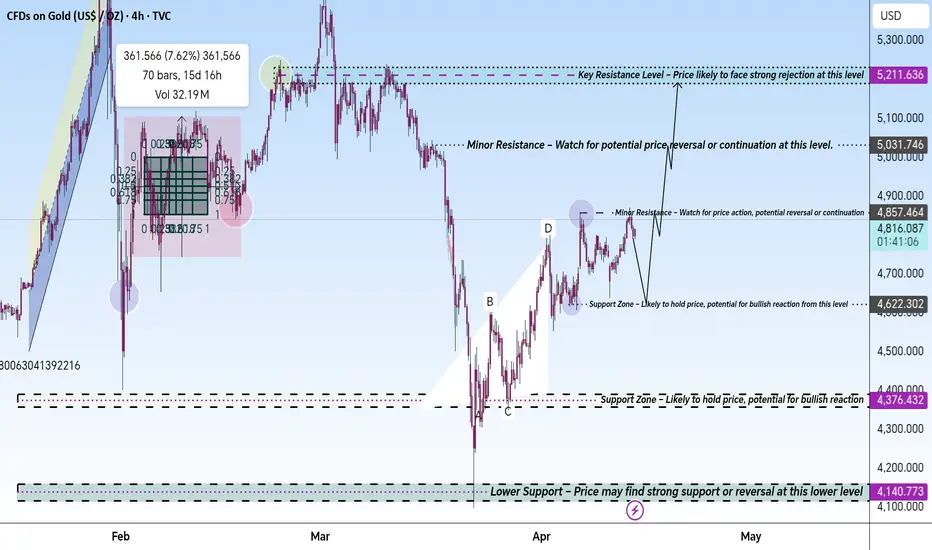
This chart offers a comprehensive analysis of Gold (XAU/USD), focusing on crucial support and resistance levels. The Key Resistance at 5,211.636 USD is a strong level where the price may face significant rejection. The Minor Resistance at 5,031.746 USD could trigger a reversal or a pause in the upward movement.
On the downside, Support Zone at 4,622.302 USD is likely to hold the price, providing a potential bullish reaction. The Critical Support at 4,376.432 USD is another important level to monitor for potential reversal or breakdown. If the price breaks lower, the Lower Support at 4,140.773 USD may serve as a strong support zone.
The Upward Trend Channel indicates overall bullish momentum, suggesting potential continued price movement upward unless these key levels are broken. Traders should watch for price action at these levels to make informed trading decisions

Publikasi terkait
Pernyataan Penyangkalan
Informasi dan publikasi ini tidak dimaksudkan, dan bukan merupakan, saran atau rekomendasi keuangan, investasi, trading, atau jenis lainnya yang diberikan atau didukung oleh TradingView. Baca selengkapnya di Ketentuan Penggunaan.
Publikasi terkait
Pernyataan Penyangkalan
Informasi dan publikasi ini tidak dimaksudkan, dan bukan merupakan, saran atau rekomendasi keuangan, investasi, trading, atau jenis lainnya yang diberikan atau didukung oleh TradingView. Baca selengkapnya di Ketentuan Penggunaan.