
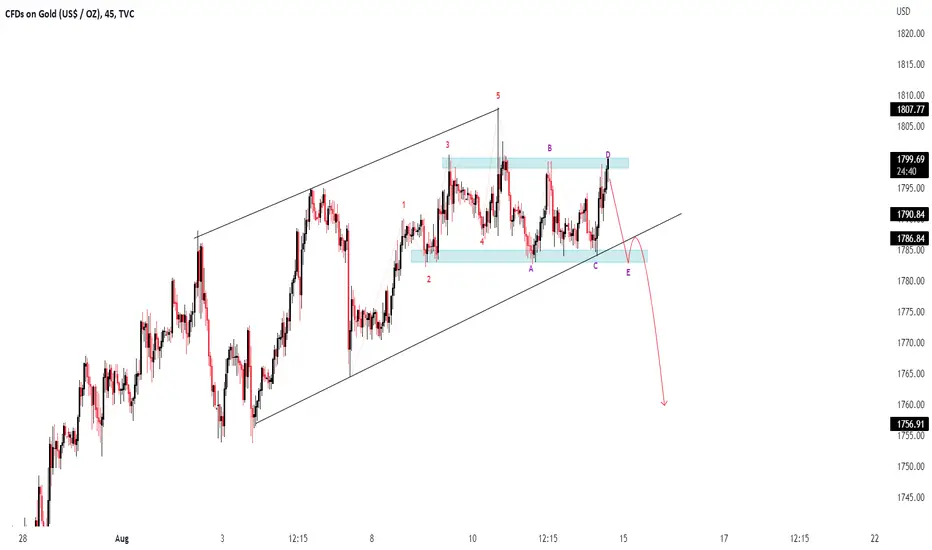
XAU/USD ( Gold / U.S Dollar ) Technical Analysis Chart Update
Time Frame - M45
According to the Pattern in Short Time Frame #STF ( #Bullish Channel ) it failed to Break the Strong Resistance Level #1798-9
According to Elliot waves it has completed the Impulsive #12345 waves and its now Following Corrective wave #ABCDE it will follow Sell Trend to complete its " E " wave
If it Breaks the Lower Trend Line #LTL and Retest it will follow More Sell

Pernyataan Penyangkalan
Informasi dan publikasi ini tidak dimaksudkan, dan bukan merupakan, saran atau rekomendasi keuangan, investasi, trading, atau jenis lainnya yang diberikan atau didukung oleh TradingView. Baca selengkapnya di Ketentuan Penggunaan.
Pernyataan Penyangkalan
Informasi dan publikasi ini tidak dimaksudkan, dan bukan merupakan, saran atau rekomendasi keuangan, investasi, trading, atau jenis lainnya yang diberikan atau didukung oleh TradingView. Baca selengkapnya di Ketentuan Penggunaan.