
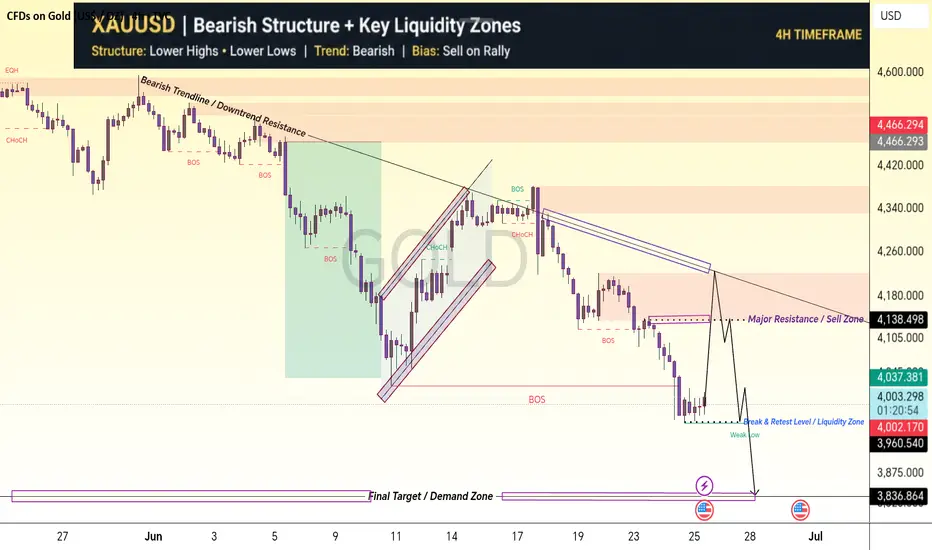
This chart represents a Smart Money Concept (SMC) based institutional market structure analysis of XAUUSD (Gold). The purpose of this idea is purely educational, showing how price respects liquidity, structure shifts, and key supply & demand zones
The market is currently in a bearish structural phase, where price is continuously forming Lower Highs (LH) and Lower Lows (LL), confirming strong institutional selling pressure. The trendline acts as dynamic resistance, showing that sellers are controlling momentum
Multiple concepts are applied in this analysis:
Market Structure Shift (BOS & CHoCH)
Liquidity Sweeps (Buy-side / Sell-side liquidity)
Institutional Order Blocks
Trendline resistance confluence
Break & Retest behavior
Final demand zone targeting
The current expectation is a continued bearish move towards deeper liquidity zones, after
minor pullbacks into resistance areas.
This analysis is not a signal but an educational breakdown of institutional trading behavior
Trendline (Descending Line)
This line represents dynamic bearish resistance. Every rejection from this line confirms that sellers are defending higher prices and maintaining downward momentum.
Major Resistance Zone (Example: 4,300 – 4,400 area)
This zone is a supply area where institutions previously sold heavily. Price is likely to react here with rejection or consolidation.
Break & Retest Level / Liquidity Zone
This level acts as a key decision point where liquidity is collected. Price may retest this area before continuing its main trend direction
BOS (Break of Structure)
Indicates trend continuation in bearish direction. Each BOS confirms that previous support has been broken and sellers are in control
CHoCH (Change of Character)
Shows temporary shift in momentum, usually used for retracement before continuation of main trend
Weak High / Weak Low
These are liquidity points where retail traders place stops. Market often returns to these zones to grab liquidity
Final Target / Demand Zone (Lower Area)
This is the ultimate liquidity target where price is expected to reach based on current bearish structure.
Current Price Area (Mid Zone)
This is a transition zone where market decides continuation or retracement. Reaction here confirms next move
This is an educational chart breakdown based on institutional concepts. Not financial advice
The market is currently in a bearish structural phase, where price is continuously forming Lower Highs (LH) and Lower Lows (LL), confirming strong institutional selling pressure. The trendline acts as dynamic resistance, showing that sellers are controlling momentum
Multiple concepts are applied in this analysis:
Market Structure Shift (BOS & CHoCH)
Liquidity Sweeps (Buy-side / Sell-side liquidity)
Institutional Order Blocks
Trendline resistance confluence
Break & Retest behavior
Final demand zone targeting
The current expectation is a continued bearish move towards deeper liquidity zones, after
minor pullbacks into resistance areas.
This analysis is not a signal but an educational breakdown of institutional trading behavior
Trendline (Descending Line)
This line represents dynamic bearish resistance. Every rejection from this line confirms that sellers are defending higher prices and maintaining downward momentum.
Major Resistance Zone (Example: 4,300 – 4,400 area)
This zone is a supply area where institutions previously sold heavily. Price is likely to react here with rejection or consolidation.
Break & Retest Level / Liquidity Zone
This level acts as a key decision point where liquidity is collected. Price may retest this area before continuing its main trend direction
BOS (Break of Structure)
Indicates trend continuation in bearish direction. Each BOS confirms that previous support has been broken and sellers are in control
CHoCH (Change of Character)
Shows temporary shift in momentum, usually used for retracement before continuation of main trend
Weak High / Weak Low
These are liquidity points where retail traders place stops. Market often returns to these zones to grab liquidity
Final Target / Demand Zone (Lower Area)
This is the ultimate liquidity target where price is expected to reach based on current bearish structure.
Current Price Area (Mid Zone)
This is a transition zone where market decides continuation or retracement. Reaction here confirms next move
This is an educational chart breakdown based on institutional concepts. Not financial advice
Catatan
This analysis running 1100 pips profit keep strong hold wait for my last target 
t.me/+HstI692sUGw0ZmRk
✅ MY FREE SIGNALS CHANNEL
✅ PERSONAL TELEGRAM
✅ FOREX BROKER USED
t.me/+pg7FHDH9Zl40MGJk
✅ MY FREE SIGNALS CHANNEL
✅ PERSONAL TELEGRAM
✅ FOREX BROKER USED
t.me/+pg7FHDH9Zl40MGJk
Pernyataan Penyangkalan
Informasi dan publikasi ini tidak dimaksudkan, dan bukan merupakan, saran atau rekomendasi keuangan, investasi, trading, atau jenis lainnya yang diberikan atau didukung oleh TradingView. Baca selengkapnya di Ketentuan Penggunaan.
t.me/+HstI692sUGw0ZmRk
✅ MY FREE SIGNALS CHANNEL
✅ PERSONAL TELEGRAM
✅ FOREX BROKER USED
t.me/+pg7FHDH9Zl40MGJk
✅ MY FREE SIGNALS CHANNEL
✅ PERSONAL TELEGRAM
✅ FOREX BROKER USED
t.me/+pg7FHDH9Zl40MGJk
Pernyataan Penyangkalan
Informasi dan publikasi ini tidak dimaksudkan, dan bukan merupakan, saran atau rekomendasi keuangan, investasi, trading, atau jenis lainnya yang diberikan atau didukung oleh TradingView. Baca selengkapnya di Ketentuan Penggunaan.