
I've been following HBAR since early 2020 when it dipped below 1 cent briefly and then took off.
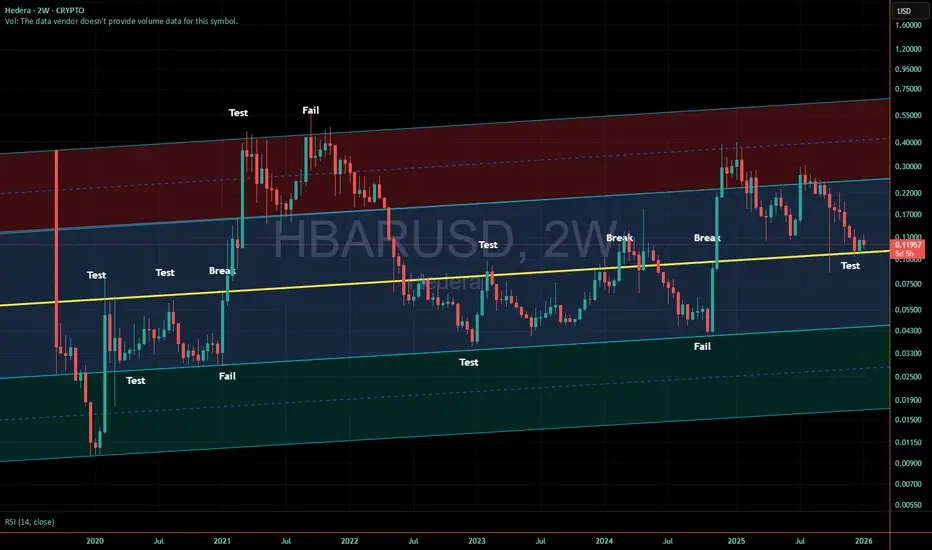
This chart is simply to show key areas of support and resistance it has been testing that are on a parallel vs the traditional horizontal S/R.
At this point, if it loses the 12 cent area around the yellow line, I'd expect a test somewhere near 4.5 cents. If that test fails to break through into the green or gets quickly bought up, it may be the last low we see in a while.
On the other hand, if the Bitcoin market drops hard affecting all crypto look to see if we see yet another move into the green box.
This chart is simply to show key areas of support and resistance it has been testing that are on a parallel vs the traditional horizontal S/R.
At this point, if it loses the 12 cent area around the yellow line, I'd expect a test somewhere near 4.5 cents. If that test fails to break through into the green or gets quickly bought up, it may be the last low we see in a while.
On the other hand, if the Bitcoin market drops hard affecting all crypto look to see if we see yet another move into the green box.

Pernyataan Penyangkalan
Informasi dan publikasi ini tidak dimaksudkan, dan bukan merupakan, saran atau rekomendasi keuangan, investasi, trading, atau jenis lainnya yang diberikan atau didukung oleh TradingView. Baca selengkapnya di Ketentuan Penggunaan.
Pernyataan Penyangkalan
Informasi dan publikasi ini tidak dimaksudkan, dan bukan merupakan, saran atau rekomendasi keuangan, investasi, trading, atau jenis lainnya yang diberikan atau didukung oleh TradingView. Baca selengkapnya di Ketentuan Penggunaan.