
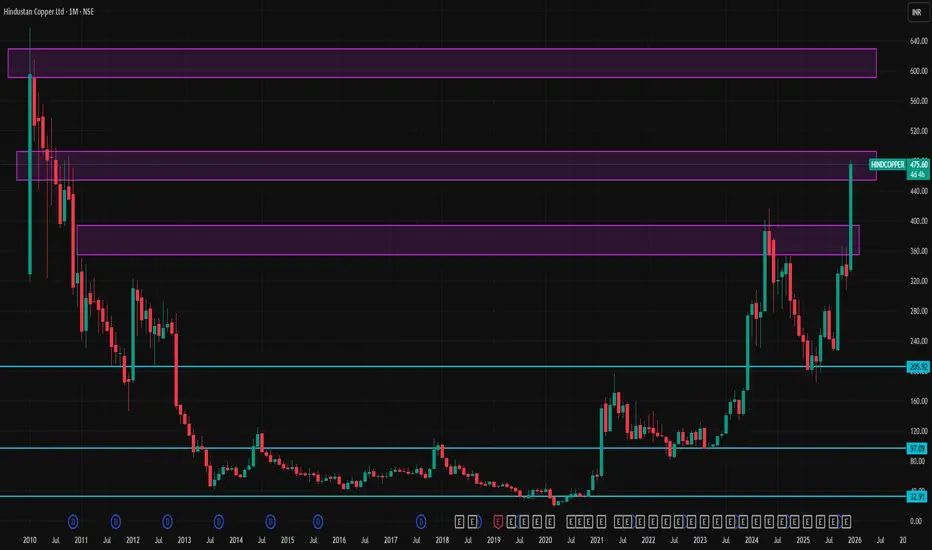
📌 Current Price (Reference)
The stock is trading near ~₹475–₹480 on NSE/BSE (Dec 2025 close).
📊 Key Levels for ~1‑Month Time Frame
🔵 Bullish / Resistance Levels
These are potential upside barriers where price may slow or reverse:
1. ~₹490–₹495 — Near recent pivot resistance zone.
2. ~₹500–₹505 — Mid‑term resistance zone (psychological/technical).
3. ~₹525–₹530 — Extended upside if momentum remains strong.
Interpretation: If price sustains above ₹490–₹495, it may attempt to test ₹500–₹530. A breakout above these zones could fuel further bullish sentiment.
🔴 Bearish / Support Levels
Important floors where buyers may step in on dips:
1. ~₹452–₹455 — Near immediate support (recent pivot low).
2. ~₹428–₹430 — Secondary support zone.
3. ~₹415–₹420 — Major support; breach could signal deeper correction.
Interpretation: If the stock drops below ₹452–₹455, watch for holds around ₹428–₹430, then ₹415–₹420. A failure to hold these levels could lead to broader consolidation.
🧠 How to Use These Levels
Range traders might look to take profit near resistance zones and buy near established supports.
Breakouts above ₹500 with volume could open room toward the ₹525–₹530 area.
Downside breaks under ~₹452 might see a pullback toward ₹428 and lower supports.
The stock is trading near ~₹475–₹480 on NSE/BSE (Dec 2025 close).
📊 Key Levels for ~1‑Month Time Frame
🔵 Bullish / Resistance Levels
These are potential upside barriers where price may slow or reverse:
1. ~₹490–₹495 — Near recent pivot resistance zone.
2. ~₹500–₹505 — Mid‑term resistance zone (psychological/technical).
3. ~₹525–₹530 — Extended upside if momentum remains strong.
Interpretation: If price sustains above ₹490–₹495, it may attempt to test ₹500–₹530. A breakout above these zones could fuel further bullish sentiment.
🔴 Bearish / Support Levels
Important floors where buyers may step in on dips:
1. ~₹452–₹455 — Near immediate support (recent pivot low).
2. ~₹428–₹430 — Secondary support zone.
3. ~₹415–₹420 — Major support; breach could signal deeper correction.
Interpretation: If the stock drops below ₹452–₹455, watch for holds around ₹428–₹430, then ₹415–₹420. A failure to hold these levels could lead to broader consolidation.
🧠 How to Use These Levels
Range traders might look to take profit near resistance zones and buy near established supports.
Breakouts above ₹500 with volume could open room toward the ₹525–₹530 area.
Downside breaks under ~₹452 might see a pullback toward ₹428 and lower supports.

Contact Knowledgehub for a detailed consultation: Dm on WhatsApp: [wa.link/a2o0kz]-
Phone No: [+91 93102 26243]-
Email: [tradingviewknowledgehub@gmail.com]---
-- Let’s achieve success together!
Phone No: [+91 93102 26243]-
Email: [tradingviewknowledgehub@gmail.com]---
-- Let’s achieve success together!
Publikasi terkait
Pernyataan Penyangkalan
Informasi dan publikasi ini tidak dimaksudkan, dan bukan merupakan, saran atau rekomendasi keuangan, investasi, trading, atau jenis lainnya yang diberikan atau didukung oleh TradingView. Baca selengkapnya di Ketentuan Penggunaan.
Contact Knowledgehub for a detailed consultation: Dm on WhatsApp: [wa.link/a2o0kz]-
Phone No: [+91 93102 26243]-
Email: [tradingviewknowledgehub@gmail.com]---
-- Let’s achieve success together!
Phone No: [+91 93102 26243]-
Email: [tradingviewknowledgehub@gmail.com]---
-- Let’s achieve success together!
Publikasi terkait
Pernyataan Penyangkalan
Informasi dan publikasi ini tidak dimaksudkan, dan bukan merupakan, saran atau rekomendasi keuangan, investasi, trading, atau jenis lainnya yang diberikan atau didukung oleh TradingView. Baca selengkapnya di Ketentuan Penggunaan.