
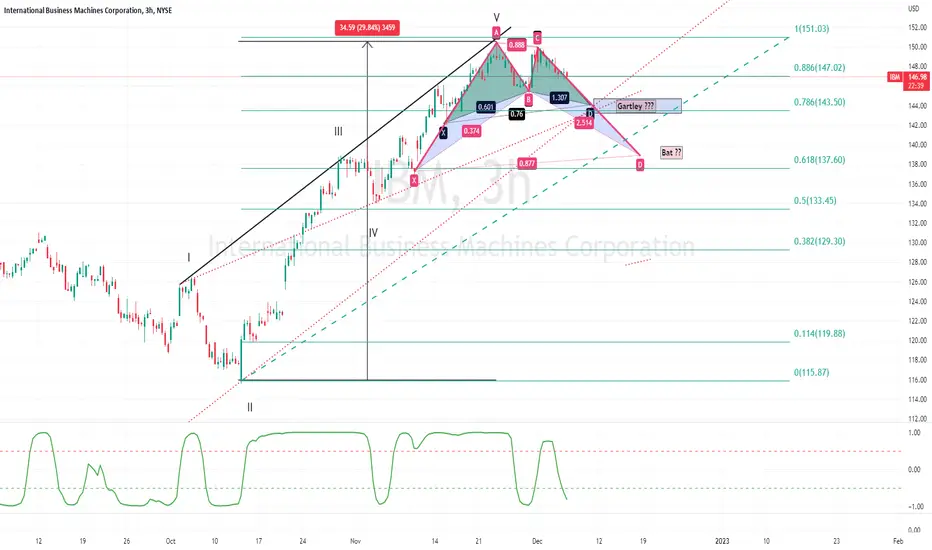
Since mid-October IBM has produced a nearly 35% gain
This would appear to have traced out a bullish impulse wave (1-2-3-4-5)
It has also created a possible Wolfe Wave top with a short term downside target of $143-$144.
Additionally one could envision two harmonic patterns in development.
In the shorter term which a Gartley pattern supports the WW thesis.
The longer term a Bat pattern supports the 1/3 retracement scenario of the October move.
With an eye on the Fed's actions next week and broader equity markets I would be looking to sell IBM price strength with a tight stop should be breach recent highs.
I will follow up if I feel a short position is warranted.
As usual this is not investment advice, so do your own due diligence.
S.
Catatan
An update... Clearly Big Blue is running against the recent market trend.I have added a pitchfork (insert) for directional clarification. We need the red-line to be breached and more importantly point B of the two harmonics to be broken.
Momentum is not going our way.

Pernyataan Penyangkalan
Informasi dan publikasi ini tidak dimaksudkan, dan bukan merupakan, saran atau rekomendasi keuangan, investasi, trading, atau jenis lainnya yang diberikan atau didukung oleh TradingView. Baca selengkapnya di Ketentuan Penggunaan.
Pernyataan Penyangkalan
Informasi dan publikasi ini tidak dimaksudkan, dan bukan merupakan, saran atau rekomendasi keuangan, investasi, trading, atau jenis lainnya yang diberikan atau didukung oleh TradingView. Baca selengkapnya di Ketentuan Penggunaan.