
📊 Current Price Snapshot
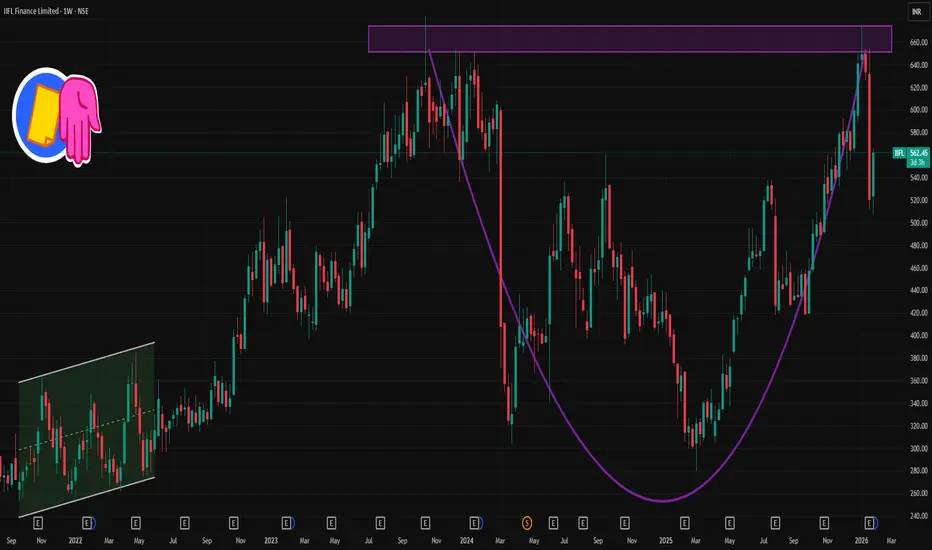
IIFL Finance share price: ~₹560–₹565 on NSE (today’s range) — with highs around ₹565 and lows near ₹540.45 earlier in today’s session.
📈 Weekly Support & Resistance (Key Levels)
These levels are derived from weekly pivot and longer‑term technical distribution — useful for swing/weekly traders:
🔹 Major Weekly Pivot Zone
Weekly Central Pivot (CPR): ~₹562–₹564 — this zone acts as the pivot around which weekly direction may tilt.
🔹 Weekly Resistance Levels
R1: ~₹613–₹616 — first major resistance if price rallies above current.
R2: ~₹650–₹672 — next higher resistance zone aligned with recent 52‑week highs.
R3: ~₹705+ — extended bullish breakout target.
🔻 Weekly Support Levels
S1: ~₹470–₹472 — first major support if selling accelerates.
S2: ~₹418–₹420 — secondary support from larger weekly pivots.
S3: ~₹326–₹330 — lowest weekly pivot support (deep correction scenario).
🧠 What this means (Weekly Macro View)
📍 Bullish Scenario
If price closes above the pivot zone (~₹562–564) on weekly charts, look for upside momentum toward ₹613–₹650 next.
📉 Bearish Scenario
A weekly close below ~₹470–₹472 could open deeper correction toward ₹418–₹380 support cluster.
IIFL Finance share price: ~₹560–₹565 on NSE (today’s range) — with highs around ₹565 and lows near ₹540.45 earlier in today’s session.
📈 Weekly Support & Resistance (Key Levels)
These levels are derived from weekly pivot and longer‑term technical distribution — useful for swing/weekly traders:
🔹 Major Weekly Pivot Zone
Weekly Central Pivot (CPR): ~₹562–₹564 — this zone acts as the pivot around which weekly direction may tilt.
🔹 Weekly Resistance Levels
R1: ~₹613–₹616 — first major resistance if price rallies above current.
R2: ~₹650–₹672 — next higher resistance zone aligned with recent 52‑week highs.
R3: ~₹705+ — extended bullish breakout target.
🔻 Weekly Support Levels
S1: ~₹470–₹472 — first major support if selling accelerates.
S2: ~₹418–₹420 — secondary support from larger weekly pivots.
S3: ~₹326–₹330 — lowest weekly pivot support (deep correction scenario).
🧠 What this means (Weekly Macro View)
📍 Bullish Scenario
If price closes above the pivot zone (~₹562–564) on weekly charts, look for upside momentum toward ₹613–₹650 next.
📉 Bearish Scenario
A weekly close below ~₹470–₹472 could open deeper correction toward ₹418–₹380 support cluster.

Contact Knowledgehub for a detailed consultation: Dm on WhatsApp: [wa.link/a2o0kz]-
Phone No: [+91 93102 26243]-
Email: [tradingviewknowledgehub@gmail.com]---
-- Let’s achieve success together!
Phone No: [+91 93102 26243]-
Email: [tradingviewknowledgehub@gmail.com]---
-- Let’s achieve success together!
Publikasi terkait
Pernyataan Penyangkalan
Informasi dan publikasi ini tidak dimaksudkan, dan bukan merupakan, saran atau rekomendasi keuangan, investasi, trading, atau jenis lainnya yang diberikan atau didukung oleh TradingView. Baca selengkapnya di Ketentuan Penggunaan.
Contact Knowledgehub for a detailed consultation: Dm on WhatsApp: [wa.link/a2o0kz]-
Phone No: [+91 93102 26243]-
Email: [tradingviewknowledgehub@gmail.com]---
-- Let’s achieve success together!
Phone No: [+91 93102 26243]-
Email: [tradingviewknowledgehub@gmail.com]---
-- Let’s achieve success together!
Publikasi terkait
Pernyataan Penyangkalan
Informasi dan publikasi ini tidak dimaksudkan, dan bukan merupakan, saran atau rekomendasi keuangan, investasi, trading, atau jenis lainnya yang diberikan atau didukung oleh TradingView. Baca selengkapnya di Ketentuan Penggunaan.