
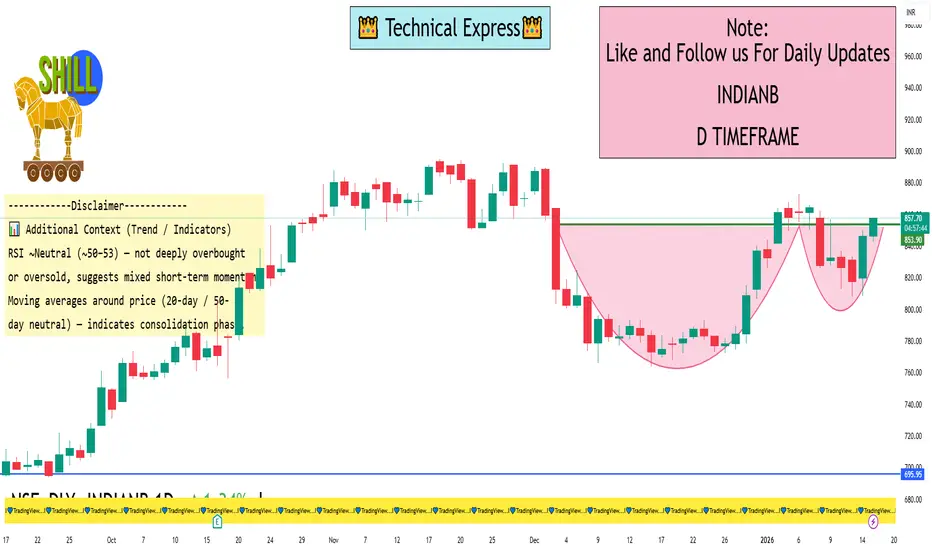
📌 Indian Bank – Daily Levels (Current / Accurate)Price Reference (Recent): ~₹832–₹835 area (last updated Jan 9-Jan 12, 2026)
🔹 Daily Pivot Point
Pivot: ~₹839.3 – ₹825.6 (multiple pivot sources)
📈 Resistance Levels
R1: ~₹850.6 – ₹838 area
R2: ~₹868.3
R3: ~₹879.6
(These are the daily upside barriers where selling pressure may emerge)
📉 Support Levels
S1: ~₹821.6 – ₹814 area
S2: ~₹810.3
S3: ~₹792.6 – ₹777 area
(These are key downside floors where buyers often step in)
🧠 How To Use These Levels (Daily Trading)
Bullish view (if price holds above pivot ~₹825–839 area):
✔ Above S1 (~₹821–822) — short-term bullish continuation likely
✔ Break above R1 (~₹850) — targets R2 (~₹868) then R3 (~₹880)
Bearish view (if price breaks below daily pivot / S1):
❌ Below S1 (~₹821) — weakness could push price toward S2 (~₹810)
❌ Sustained below S3 (~₹792–₹777) — could signal deeper correction
⚠️ Quick Reminder
These technical levels are based on latest publicly available pivot analysis and may differ slightly from live real-time data on your trading platform. Always verify live quotes on your charting tool before entering trades.
🔹 Daily Pivot Point
Pivot: ~₹839.3 – ₹825.6 (multiple pivot sources)
📈 Resistance Levels
R1: ~₹850.6 – ₹838 area
R2: ~₹868.3
R3: ~₹879.6
(These are the daily upside barriers where selling pressure may emerge)
📉 Support Levels
S1: ~₹821.6 – ₹814 area
S2: ~₹810.3
S3: ~₹792.6 – ₹777 area
(These are key downside floors where buyers often step in)
🧠 How To Use These Levels (Daily Trading)
Bullish view (if price holds above pivot ~₹825–839 area):
✔ Above S1 (~₹821–822) — short-term bullish continuation likely
✔ Break above R1 (~₹850) — targets R2 (~₹868) then R3 (~₹880)
Bearish view (if price breaks below daily pivot / S1):
❌ Below S1 (~₹821) — weakness could push price toward S2 (~₹810)
❌ Sustained below S3 (~₹792–₹777) — could signal deeper correction
⚠️ Quick Reminder
These technical levels are based on latest publicly available pivot analysis and may differ slightly from live real-time data on your trading platform. Always verify live quotes on your charting tool before entering trades.

Publikasi terkait
Pernyataan Penyangkalan
Informasi dan publikasi ini tidak dimaksudkan, dan bukan merupakan, saran atau rekomendasi keuangan, investasi, trading, atau jenis lainnya yang diberikan atau didukung oleh TradingView. Baca selengkapnya di Ketentuan Penggunaan.
Publikasi terkait
Pernyataan Penyangkalan
Informasi dan publikasi ini tidak dimaksudkan, dan bukan merupakan, saran atau rekomendasi keuangan, investasi, trading, atau jenis lainnya yang diberikan atau didukung oleh TradingView. Baca selengkapnya di Ketentuan Penggunaan.