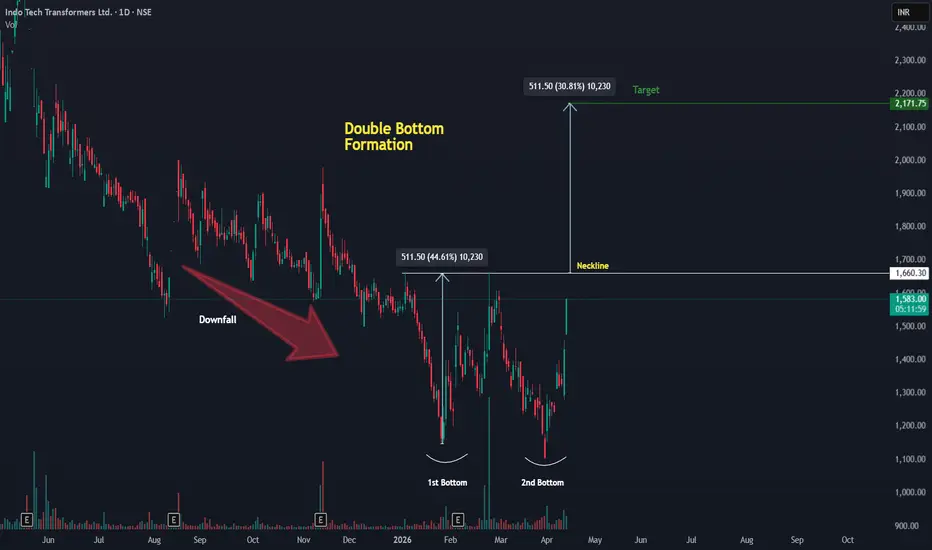
The stock  INDOTECH has witnessed a significant downfall over the past sessions, indicating sustained bearish pressure. However, price action now suggests that it is nearing the completion of a Double Bottom pattern — a classic bullish reversal structure.
The formation of two consecutive lows around a similar price zone indicates strong support and potential exhaustion of selling momentum. Currently, the price is approaching the neckline, and a decisive breakout above this level would confirm the pattern and signal a possible trend reversal.
🔹 Trade Setup:
Entry: After a confirmed breakout above the neckline
Target: 2100 – 2200
Stop Loss: Low of the breakout candle
📌 Patience is key — avoid early entries and wait for a strong breakout confirmation with volume support.
⚠️ Disclaimer: This analysis is for educational purposes only and does not constitute any buy or sell recommendation.
INDOTECH has witnessed a significant downfall over the past sessions, indicating sustained bearish pressure. However, price action now suggests that it is nearing the completion of a Double Bottom pattern — a classic bullish reversal structure.The formation of two consecutive lows around a similar price zone indicates strong support and potential exhaustion of selling momentum. Currently, the price is approaching the neckline, and a decisive breakout above this level would confirm the pattern and signal a possible trend reversal.
🔹 Trade Setup:
Entry: After a confirmed breakout above the neckline
Target: 2100 – 2200
Stop Loss: Low of the breakout candle
📌 Patience is key — avoid early entries and wait for a strong breakout confirmation with volume support.
⚠️ Disclaimer: This analysis is for educational purposes only and does not constitute any buy or sell recommendation.
Trade aktif
At today’s close, the stock has successfully closed above the neckline, confirming the breakout of the Double Bottom pattern and signaling a potential bullish reversal.🔹 Trade Plan Update:
Entry: Breakout confirmed on closing basis above neckline
Target: 2100 – 2200
Stop Loss: Low of today’s breakout candle
The structure now favors upside momentum, and the breakout adds strength to the bullish outlook.
⚠️ Disclaimer: This analysis is for educational purposes only and does not constitute any buy or sell recommendation.
Trading ditutup: target tercapai

Publikasi terkait
Pernyataan Penyangkalan
Informasi dan publikasi ini tidak dimaksudkan, dan bukan merupakan, saran atau rekomendasi keuangan, investasi, trading, atau jenis lainnya yang diberikan atau didukung oleh TradingView. Baca selengkapnya di Ketentuan Penggunaan.
Publikasi terkait
Pernyataan Penyangkalan
Informasi dan publikasi ini tidak dimaksudkan, dan bukan merupakan, saran atau rekomendasi keuangan, investasi, trading, atau jenis lainnya yang diberikan atau didukung oleh TradingView. Baca selengkapnya di Ketentuan Penggunaan.