
📍 Latest Price Context
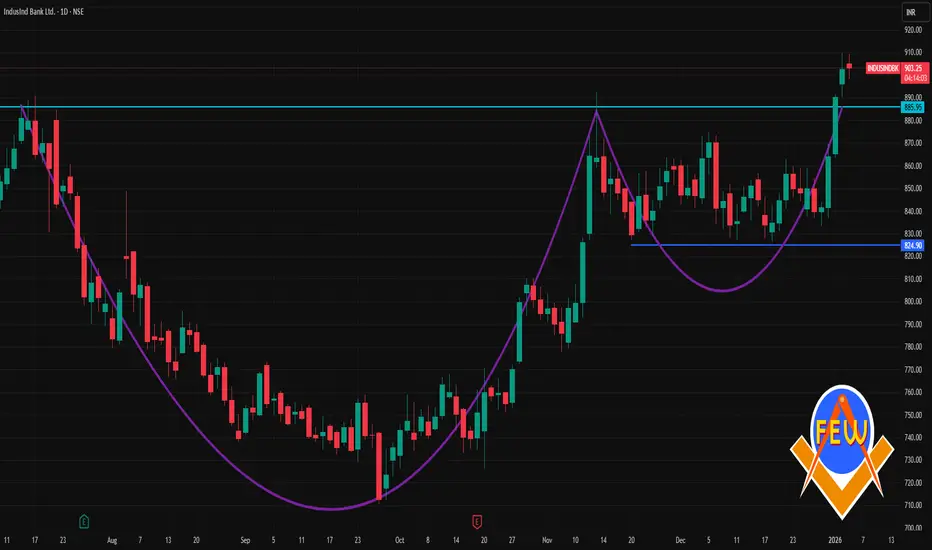
The stock recently closed around ≈ ₹902.45 on the NSE (close of 2 Jan 2026) with intraday range ~₹890‑₹910.
📊 Daily Technical Levels (Support & Resistance)
🔸 Pivot & Major Levels
Level Price (INR)
Pivot Point (Daily) ~₹900.8
Resistance 1 (R1) ~₹911.4
Resistance 2 (R2) ~₹920.3
Resistance 3 (R3) ~₹930.9
Support 1 (S1) ~₹891.9
Support 2 (S2) ~₹881.3
Support 3 (S3) ~₹872.4
📌 Additional Daily Support/Resistance Zones
Near‑term support cluster: ₹842–₹840‑ish (seen on multiple technical sources).
Daily resistance region around: ₹856–₹871 (short swing resistances).
These levels can act as reaction zones if price moves sharply away from pivot — useful if daily volatility increases.
🧠 How to Use These Levels Intraday
👉 Bullish scenario:
Price sustains above the pivot (~₹900.8) → watch for break above R1 (~₹911+) and then R2 (~₹920+).
👉 Bearish scenario:
If price slips below S1 (~₹891.9) → next stops S2 (~₹881.3) and S3 (~₹872.4).
These levels are widely used by day traders for entries, exits & stop placements.
The stock recently closed around ≈ ₹902.45 on the NSE (close of 2 Jan 2026) with intraday range ~₹890‑₹910.
📊 Daily Technical Levels (Support & Resistance)
🔸 Pivot & Major Levels
Level Price (INR)
Pivot Point (Daily) ~₹900.8
Resistance 1 (R1) ~₹911.4
Resistance 2 (R2) ~₹920.3
Resistance 3 (R3) ~₹930.9
Support 1 (S1) ~₹891.9
Support 2 (S2) ~₹881.3
Support 3 (S3) ~₹872.4
📌 Additional Daily Support/Resistance Zones
Near‑term support cluster: ₹842–₹840‑ish (seen on multiple technical sources).
Daily resistance region around: ₹856–₹871 (short swing resistances).
These levels can act as reaction zones if price moves sharply away from pivot — useful if daily volatility increases.
🧠 How to Use These Levels Intraday
👉 Bullish scenario:
Price sustains above the pivot (~₹900.8) → watch for break above R1 (~₹911+) and then R2 (~₹920+).
👉 Bearish scenario:
If price slips below S1 (~₹891.9) → next stops S2 (~₹881.3) and S3 (~₹872.4).
These levels are widely used by day traders for entries, exits & stop placements.

Contact Knowledgehub for a detailed consultation: Dm on WhatsApp: [wa.link/a2o0kz]-
Phone No: [+91 93102 26243]-
Email: [tradingviewknowledgehub@gmail.com]---
-- Let’s achieve success together!
Phone No: [+91 93102 26243]-
Email: [tradingviewknowledgehub@gmail.com]---
-- Let’s achieve success together!
Publikasi terkait
Pernyataan Penyangkalan
Informasi dan publikasi ini tidak dimaksudkan, dan bukan merupakan, saran atau rekomendasi keuangan, investasi, trading, atau jenis lainnya yang diberikan atau didukung oleh TradingView. Baca selengkapnya di Ketentuan Penggunaan.
Contact Knowledgehub for a detailed consultation: Dm on WhatsApp: [wa.link/a2o0kz]-
Phone No: [+91 93102 26243]-
Email: [tradingviewknowledgehub@gmail.com]---
-- Let’s achieve success together!
Phone No: [+91 93102 26243]-
Email: [tradingviewknowledgehub@gmail.com]---
-- Let’s achieve success together!
Publikasi terkait
Pernyataan Penyangkalan
Informasi dan publikasi ini tidak dimaksudkan, dan bukan merupakan, saran atau rekomendasi keuangan, investasi, trading, atau jenis lainnya yang diberikan atau didukung oleh TradingView. Baca selengkapnya di Ketentuan Penggunaan.