
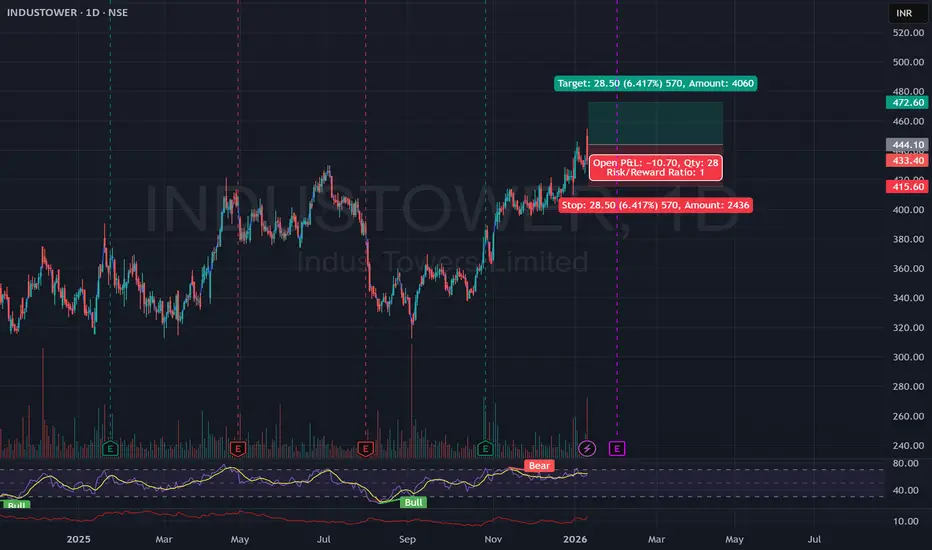
The chart for Indus Towers (INDUSTOWER) shows a strong bullish setup. Here are the technical reasons why it is currently positioned to move higher:
Bullish Breakout: The price has recently broken above a significant resistance zone near 420–430. This "breakout" suggests that buyers have regained control after a period of consolidation.
Higher Highs & Lows: On the daily (1D) timeframe, the stock is in a clear uptrend. It consistently forms higher lows (support moving up) and higher highs, which is a classic signal of sustained demand.
Support Flip: Previous resistance around 415 is now acting as a "floor" (support). The trade setup in your image uses this level as a safety net (Stop Loss), indicating a high-conviction area where buyers are expected to step in.
Momentum & Volume: The recent price surge is accompanied by healthy volume (shown at the bottom), confirming that the move up is backed by institutional or large-scale buying rather than random fluctuation.
Target Level: The chart identifies a clear technical target at 472.60, which aligns with the next major historical resistance level.
Summary: The stock has transitioned from a sideways range into a confirmed uptrend by breaking key resistance with momentum.
Bullish Breakout: The price has recently broken above a significant resistance zone near 420–430. This "breakout" suggests that buyers have regained control after a period of consolidation.
Higher Highs & Lows: On the daily (1D) timeframe, the stock is in a clear uptrend. It consistently forms higher lows (support moving up) and higher highs, which is a classic signal of sustained demand.
Support Flip: Previous resistance around 415 is now acting as a "floor" (support). The trade setup in your image uses this level as a safety net (Stop Loss), indicating a high-conviction area where buyers are expected to step in.
Momentum & Volume: The recent price surge is accompanied by healthy volume (shown at the bottom), confirming that the move up is backed by institutional or large-scale buying rather than random fluctuation.
Target Level: The chart identifies a clear technical target at 472.60, which aligns with the next major historical resistance level.
Summary: The stock has transitioned from a sideways range into a confirmed uptrend by breaking key resistance with momentum.

Pernyataan Penyangkalan
Informasi dan publikasi ini tidak dimaksudkan, dan bukan merupakan, saran atau rekomendasi keuangan, investasi, trading, atau jenis lainnya yang diberikan atau didukung oleh TradingView. Baca selengkapnya di Ketentuan Penggunaan.
Pernyataan Penyangkalan
Informasi dan publikasi ini tidak dimaksudkan, dan bukan merupakan, saran atau rekomendasi keuangan, investasi, trading, atau jenis lainnya yang diberikan atau didukung oleh TradingView. Baca selengkapnya di Ketentuan Penggunaan.