
Chart Analysis - Intracom Holdings (CR)
The chart illustrates the following:
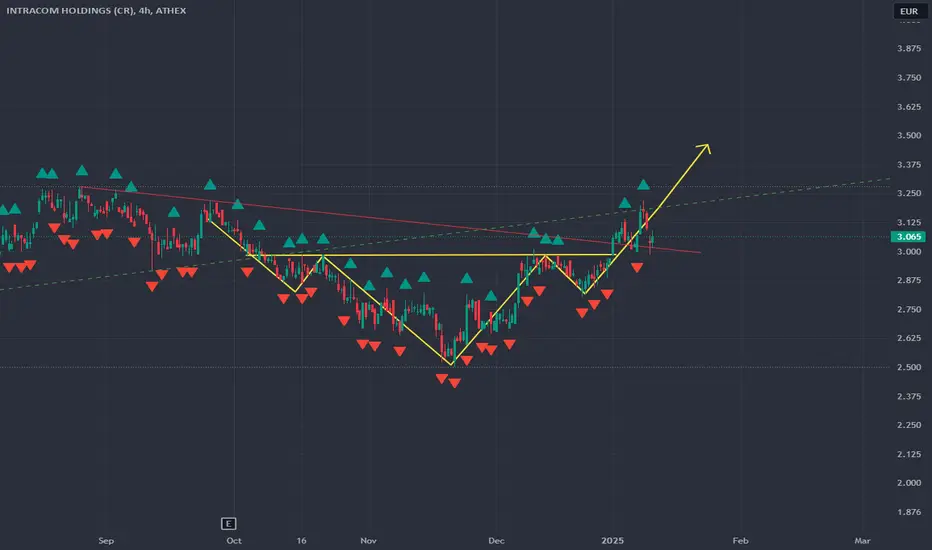
Double Bottom Formation: A clear double bottom pattern has been formed, with the price breaking above the neckline around €3.00. This breakout signals potential further upside.
Uptrend Confirmation: After breaking the neckline, the price has continued upward, reaching the resistance zone at €3.12. This movement aligns with the typical progression of a double bottom pattern.
Support and Resistance:
Support: The neckline area around €3.00 now acts as a strong support level.
Resistance: The price faces short-term resistance at €3.12. A breakout above this level could trigger additional upside momentum.
Outlook: As long as the €3.00 support holds and the €3.12 resistance is broken, the next target is projected around €3.25, with a potential final target at €3.50.
Technical Indicators:
The breakout is supported by positive momentum.
Trendlines indicate a continuation of the upward trend.
The chart illustrates the following:
Double Bottom Formation: A clear double bottom pattern has been formed, with the price breaking above the neckline around €3.00. This breakout signals potential further upside.
Uptrend Confirmation: After breaking the neckline, the price has continued upward, reaching the resistance zone at €3.12. This movement aligns with the typical progression of a double bottom pattern.
Support and Resistance:
Support: The neckline area around €3.00 now acts as a strong support level.
Resistance: The price faces short-term resistance at €3.12. A breakout above this level could trigger additional upside momentum.
Outlook: As long as the €3.00 support holds and the €3.12 resistance is broken, the next target is projected around €3.25, with a potential final target at €3.50.
Technical Indicators:
The breakout is supported by positive momentum.
Trendlines indicate a continuation of the upward trend.

Pernyataan Penyangkalan
Informasi dan publikasi ini tidak dimaksudkan, dan bukan merupakan, saran atau rekomendasi keuangan, investasi, trading, atau jenis lainnya yang diberikan atau didukung oleh TradingView. Baca selengkapnya di Ketentuan Penggunaan.
Pernyataan Penyangkalan
Informasi dan publikasi ini tidak dimaksudkan, dan bukan merupakan, saran atau rekomendasi keuangan, investasi, trading, atau jenis lainnya yang diberikan atau didukung oleh TradingView. Baca selengkapnya di Ketentuan Penggunaan.