
📊 Current Context
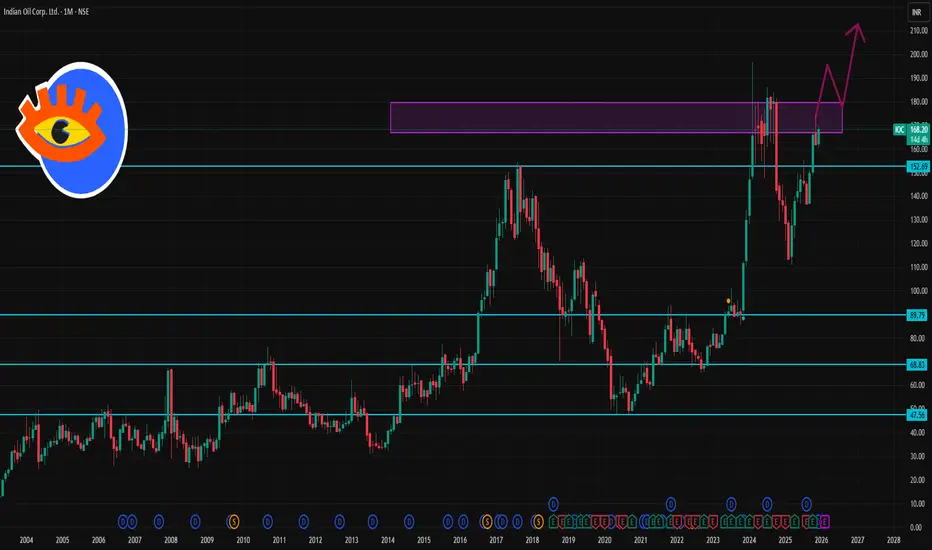
IOC is trading around the ₹166–₹168 range as of mid‑December 2025.
Over the last month, the stock has seen a slight decline (~‑2.7% to ‑3.6% depending on source).
🟢 Key 1‑Month Support Levels
These are levels where the price may find buying interest if the stock pulls back:
✅ Primary Support: ~₹164–₹162
➡️ Near recent lows and pivot zone where short‑term buyers could step in.
✅ Lower Support: ~₹160–₹158
➡️ Broader support band from slight chart congestion.
⚠️ Deep Support: ~₹138–₹135
➡️ A deeper correction zone identified by longer‑term indicators — likely only relevant if broader markets turn very weak.
🔴 Key 1‑Month Resistance Levels
These are price points that may cap upside near‑term:
🚧 Immediate Resistance: ~₹170–₹171
➡️ Short‑term hurdle around recent highs.
🚧 Next Resistance: ~₹172–₹173
➡️ Slightly stronger resistance if stock breaks above ₹171.
🚧 Higher Resistance: ~₹176–₹177+
➡️ Breakout zone toward the upper end of the near‑term range.
IOC is trading around the ₹166–₹168 range as of mid‑December 2025.
Over the last month, the stock has seen a slight decline (~‑2.7% to ‑3.6% depending on source).
🟢 Key 1‑Month Support Levels
These are levels where the price may find buying interest if the stock pulls back:
✅ Primary Support: ~₹164–₹162
➡️ Near recent lows and pivot zone where short‑term buyers could step in.
✅ Lower Support: ~₹160–₹158
➡️ Broader support band from slight chart congestion.
⚠️ Deep Support: ~₹138–₹135
➡️ A deeper correction zone identified by longer‑term indicators — likely only relevant if broader markets turn very weak.
🔴 Key 1‑Month Resistance Levels
These are price points that may cap upside near‑term:
🚧 Immediate Resistance: ~₹170–₹171
➡️ Short‑term hurdle around recent highs.
🚧 Next Resistance: ~₹172–₹173
➡️ Slightly stronger resistance if stock breaks above ₹171.
🚧 Higher Resistance: ~₹176–₹177+
➡️ Breakout zone toward the upper end of the near‑term range.

Contact Knowledgehub for a detailed consultation: Dm on WhatsApp: [wa.link/a2o0kz]-
Phone No: [+91 93102 26243]-
Email: [tradingviewknowledgehub@gmail.com]---
-- Let’s achieve success together!
Phone No: [+91 93102 26243]-
Email: [tradingviewknowledgehub@gmail.com]---
-- Let’s achieve success together!
Publikasi terkait
Pernyataan Penyangkalan
Informasi dan publikasi ini tidak dimaksudkan, dan bukan merupakan, saran atau rekomendasi keuangan, investasi, trading, atau jenis lainnya yang diberikan atau didukung oleh TradingView. Baca selengkapnya di Ketentuan Penggunaan.
Contact Knowledgehub for a detailed consultation: Dm on WhatsApp: [wa.link/a2o0kz]-
Phone No: [+91 93102 26243]-
Email: [tradingviewknowledgehub@gmail.com]---
-- Let’s achieve success together!
Phone No: [+91 93102 26243]-
Email: [tradingviewknowledgehub@gmail.com]---
-- Let’s achieve success together!
Publikasi terkait
Pernyataan Penyangkalan
Informasi dan publikasi ini tidak dimaksudkan, dan bukan merupakan, saran atau rekomendasi keuangan, investasi, trading, atau jenis lainnya yang diberikan atau didukung oleh TradingView. Baca selengkapnya di Ketentuan Penggunaan.