
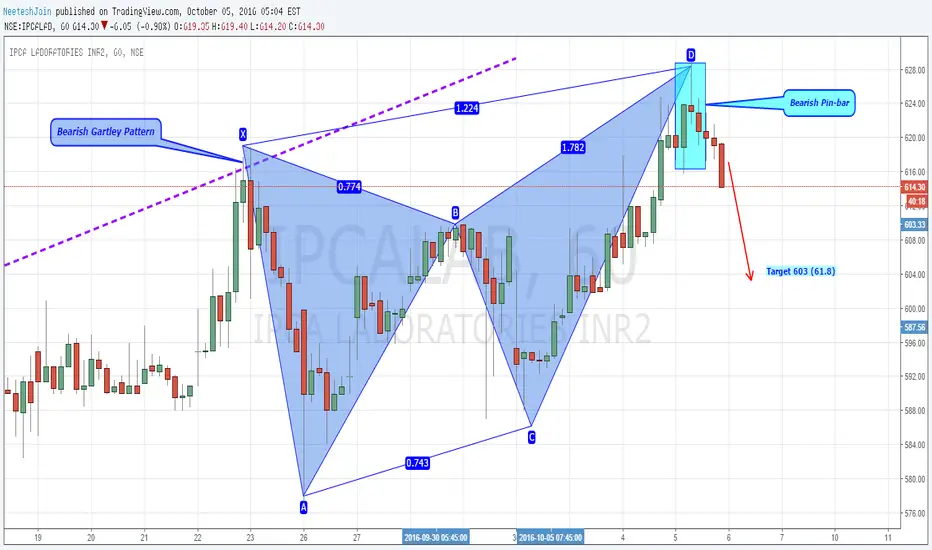
Previously on daily chart, it is been observed that the price action is ranging in a uptrending channel. Today, on hourly chart, there is formation of Bearish Gartley pattern has been observed which indicates selling pressure at 630 levels, where Bearish Pin-bar pattern is also observed. There is also a MACD crossover that to be noticed too. The above said factors indicating bearishness in the chart and It shall further move down.
Target 1: 603
Stoploss: 625
Target 1: 603
Stoploss: 625
Trade aktif
Correction: It is a bearish Butterfly patternTrade aktif
Price action breaking out 616 levels, now shall move to targets.Trading ditutup: target tercapai
Targets achieved successfully, RegardsTrade aktif
Analysis done for target 2, now shall reach to 596 levels. 
Publikasi terkait
Pernyataan Penyangkalan
Informasi dan publikasi ini tidak dimaksudkan, dan bukan merupakan, saran atau rekomendasi keuangan, investasi, trading, atau jenis lainnya yang diberikan atau didukung oleh TradingView. Baca selengkapnya di Ketentuan Penggunaan.
Publikasi terkait
Pernyataan Penyangkalan
Informasi dan publikasi ini tidak dimaksudkan, dan bukan merupakan, saran atau rekomendasi keuangan, investasi, trading, atau jenis lainnya yang diberikan atau didukung oleh TradingView. Baca selengkapnya di Ketentuan Penggunaan.