
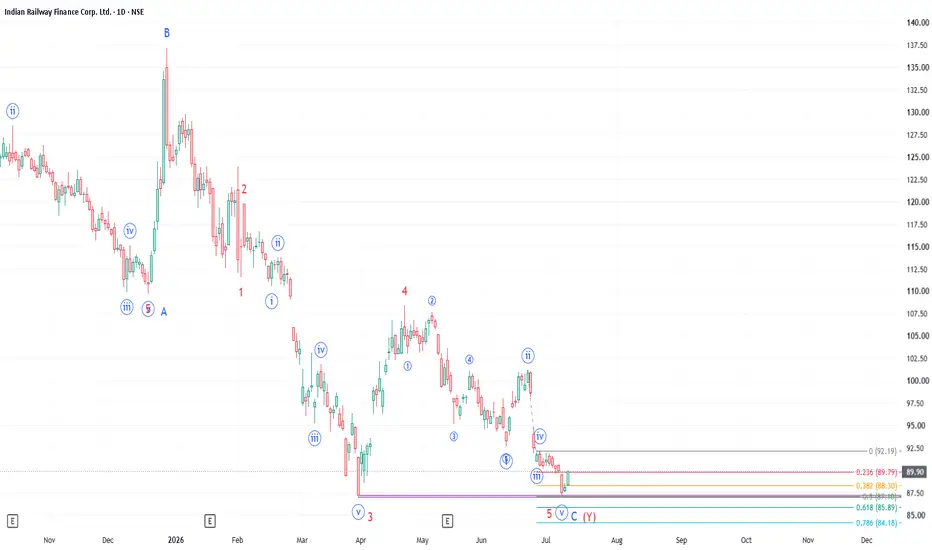
IRFC has been undergoing a very long correction since 15 July 2024. (i.e. correction for last 2 years) after completion of its first Primary Degree Impulse wave formation.
The correction is a double zigzag, i.e. WXY pattern. Zigzag, one of the three primary corrective structures with a 5-3-5 sequence results in deep correction. When one zigzag (Wave W) could not achieve the required correction, another zigzag (Wave Y) gets formed after a brief counter wave formation (Wave X).
In the last two years, the stock had completed Wave W, Wave X, Wave A and Wave B of second zigzag (Wave Y). Wave B of Wave Y got completed on 29 Dec 2025 as given in the chart. Stock has already corrected more than 61.8%.
Wave C has been in progress. Wave 3 of said Wave C got completed on 30 Mar 2026 (price of 87.00). It is highly likely that stock has completed Wave 5 of said Wave C at similar price levels on 8 July or could be completing by retesting same levels (as given in the chart).
One may consider going long on the stock with a stop loss of 85.25 or wait for confirmation of new impulse formation and enter.

ChartTheWave |
t.me/chartthewave
This channel is a common forum for "Elliott Wave Principle" enthusiasts, learners and practitioners. We aim to build a team of traders who practice EWP for common benefit; co-learn, teach, share, validate and benefit.
t.me/chartthewave
This channel is a common forum for "Elliott Wave Principle" enthusiasts, learners and practitioners. We aim to build a team of traders who practice EWP for common benefit; co-learn, teach, share, validate and benefit.
Pernyataan Penyangkalan
Informasi dan publikasi ini tidak dimaksudkan, dan bukan merupakan, saran atau rekomendasi keuangan, investasi, trading, atau jenis lainnya yang diberikan atau didukung oleh TradingView. Baca selengkapnya di Ketentuan Penggunaan.
ChartTheWave |
t.me/chartthewave
This channel is a common forum for "Elliott Wave Principle" enthusiasts, learners and practitioners. We aim to build a team of traders who practice EWP for common benefit; co-learn, teach, share, validate and benefit.
t.me/chartthewave
This channel is a common forum for "Elliott Wave Principle" enthusiasts, learners and practitioners. We aim to build a team of traders who practice EWP for common benefit; co-learn, teach, share, validate and benefit.
Pernyataan Penyangkalan
Informasi dan publikasi ini tidak dimaksudkan, dan bukan merupakan, saran atau rekomendasi keuangan, investasi, trading, atau jenis lainnya yang diberikan atau didukung oleh TradingView. Baca selengkapnya di Ketentuan Penggunaan.