
IRUS is a stock market index that tracks the performance of leading Russian companies across multiple sectors, providing a broad view of the Russian equity market.
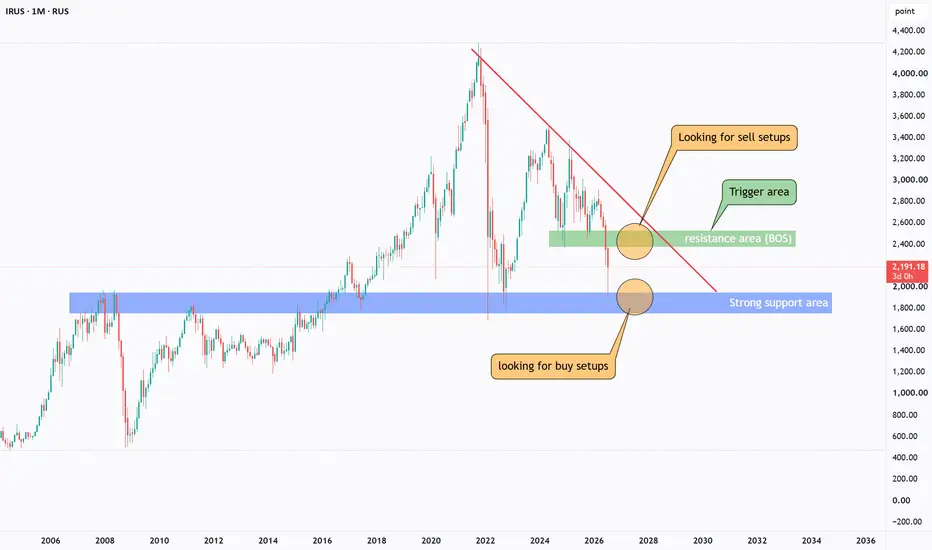
From a technical perspective, IRUS has recently provided the first important indication that the broader trend may be shifting from bullish to bearish after breaking below the green trigger area, which marked the previous major swing low.
Price is now testing a major blue support area, where a technical reaction may develop. Until the market confirms its next directional move, price is likely to remain between this support and the green resistance area.
⭕As long as price continues to respect the blue support zone, we can start looking for long setups on lower timeframes, anticipating a bullish reaction from the current area.
⭕As price approaches the upper green resistance area, lower timeframes may provide opportunities to look for short setups, while the broader structure remains under pressure.
⭕A clear break below the blue support area would strengthen the bearish scenario, while a break above the green resistance area and the red trendline would provide the first strong indication that buyers are regaining control and that bullish momentum is returning.
The reaction between these two key technical zones may determine whether the market confirms the new bearish structure or transitions back into a broader bullish trend.
⚠️Disclaimer: This analysis reflects my personal market view and is not financial advice.
Rayan Nasser
#IRUS #Russia #RussiaIndex #Indices #TechnicalAnalysis #PriceAction #Trading #MarketStructure
From a technical perspective, IRUS has recently provided the first important indication that the broader trend may be shifting from bullish to bearish after breaking below the green trigger area, which marked the previous major swing low.
Price is now testing a major blue support area, where a technical reaction may develop. Until the market confirms its next directional move, price is likely to remain between this support and the green resistance area.
⭕As long as price continues to respect the blue support zone, we can start looking for long setups on lower timeframes, anticipating a bullish reaction from the current area.
⭕As price approaches the upper green resistance area, lower timeframes may provide opportunities to look for short setups, while the broader structure remains under pressure.
⭕A clear break below the blue support area would strengthen the bearish scenario, while a break above the green resistance area and the red trendline would provide the first strong indication that buyers are regaining control and that bullish momentum is returning.
The reaction between these two key technical zones may determine whether the market confirms the new bearish structure or transitions back into a broader bullish trend.
⚠️Disclaimer: This analysis reflects my personal market view and is not financial advice.
Rayan Nasser
#IRUS #Russia #RussiaIndex #Indices #TechnicalAnalysis #PriceAction #Trading #MarketStructure

Pernyataan Penyangkalan
Informasi dan publikasi ini tidak dimaksudkan, dan bukan merupakan, saran atau rekomendasi keuangan, investasi, trading, atau jenis lainnya yang diberikan atau didukung oleh TradingView. Baca selengkapnya di Ketentuan Penggunaan.
Pernyataan Penyangkalan
Informasi dan publikasi ini tidak dimaksudkan, dan bukan merupakan, saran atau rekomendasi keuangan, investasi, trading, atau jenis lainnya yang diberikan atau didukung oleh TradingView. Baca selengkapnya di Ketentuan Penggunaan.