
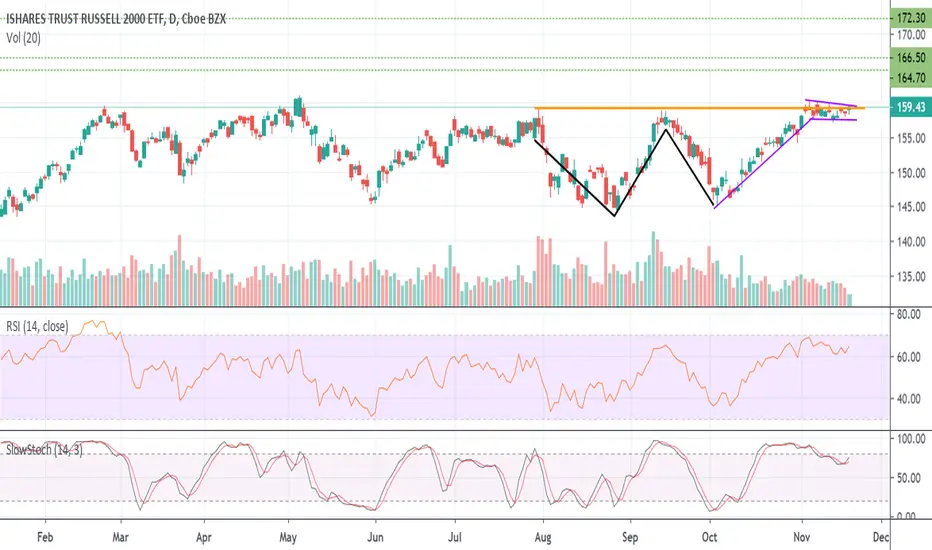
The Russell 2000 ETF has seen a price run-up since early October as it emerged from an oversold condition. The recent pullback has created what may be a bull flag (magenta trendlines) that is close to breaking out. The IWM also seems to be gaining some relative strength vs the SPX which should bode well for this ETF gaining in price.
Upon further evaluation of this daily chart, I might also be able to make a case for an Ascending Triangle pattern (orange horizontal trendline + magenta rising trendline) or a "W" bottom pattern (black trendlines). Regardless of which pattern you accept, all of them are bullish in nature.
I have labeled two potential price targets I am looking at using the Fibonacci Extension tool again. I used the 50% , 61.8%, & 100% levels for these price targets.
Upon further evaluation of this daily chart, I might also be able to make a case for an Ascending Triangle pattern (orange horizontal trendline + magenta rising trendline) or a "W" bottom pattern (black trendlines). Regardless of which pattern you accept, all of them are bullish in nature.
I have labeled two potential price targets I am looking at using the Fibonacci Extension tool again. I used the 50% , 61.8%, & 100% levels for these price targets.
Catatan
Broke out yesterday. Let's see where it goes from here.
Pernyataan Penyangkalan
Informasi dan publikasi ini tidak dimaksudkan, dan bukan merupakan, saran atau rekomendasi keuangan, investasi, trading, atau jenis lainnya yang diberikan atau didukung oleh TradingView. Baca selengkapnya di Ketentuan Penggunaan.
Pernyataan Penyangkalan
Informasi dan publikasi ini tidak dimaksudkan, dan bukan merupakan, saran atau rekomendasi keuangan, investasi, trading, atau jenis lainnya yang diberikan atau didukung oleh TradingView. Baca selengkapnya di Ketentuan Penggunaan.