
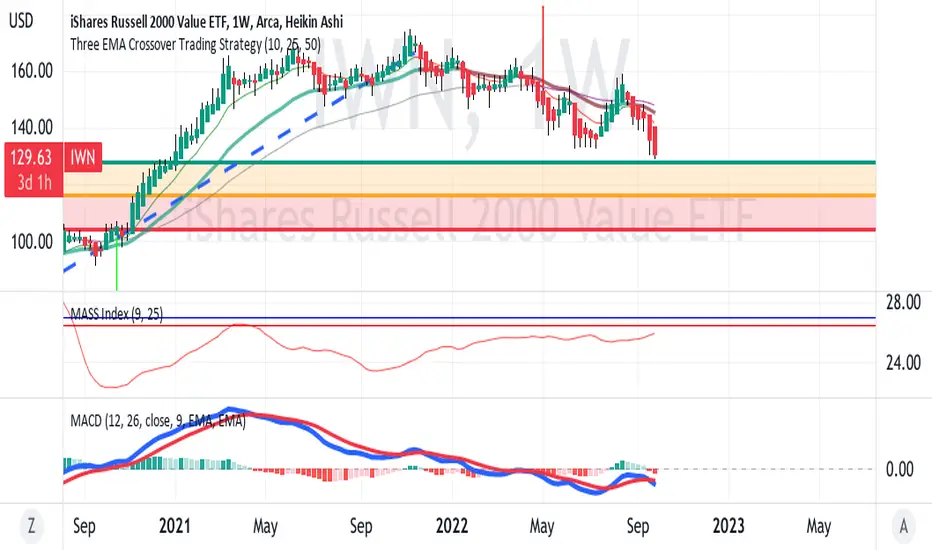
IWN as shown on the weekly chart has been obviously in a downtrend as also shown by
the EMA ribbon.
Using the uptrend from the Covid crash into November 2021 and then a retracement from that,
IWN is approchaing the 38.2 Fibonacci level at 128
From there it could bounce up or continue the downtrend.
The Mass Index being below 27 suggests a continuation before any potential reversal.
The MACD indicator shows the MACD in blue crossing down on the signal in red.
This also suggests more downtrend.
All in all, this analysis is bearish on the Russell index and its ETF.

Pernyataan Penyangkalan
Informasi dan publikasi ini tidak dimaksudkan, dan bukan merupakan, saran atau rekomendasi keuangan, investasi, trading, atau jenis lainnya yang diberikan atau didukung oleh TradingView. Baca selengkapnya di Ketentuan Penggunaan.
Pernyataan Penyangkalan
Informasi dan publikasi ini tidak dimaksudkan, dan bukan merupakan, saran atau rekomendasi keuangan, investasi, trading, atau jenis lainnya yang diberikan atau didukung oleh TradingView. Baca selengkapnya di Ketentuan Penggunaan.