
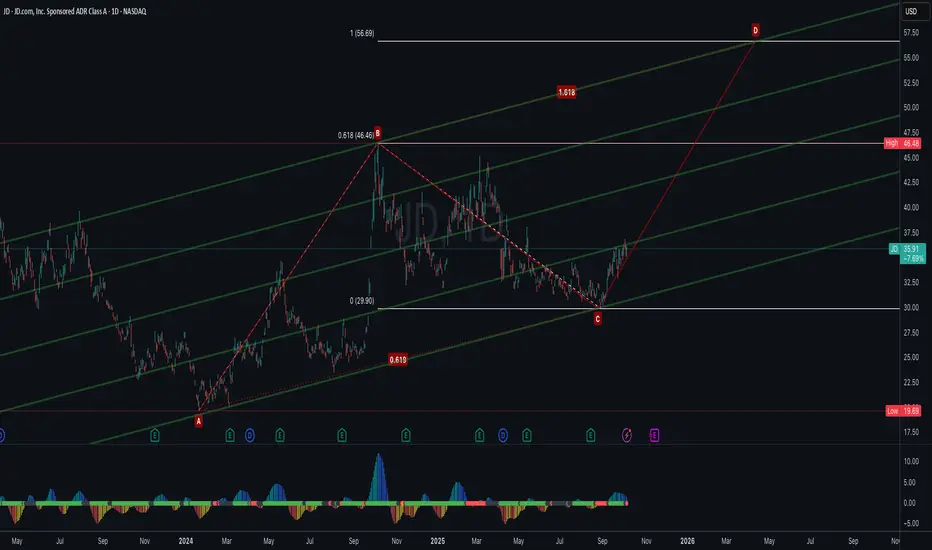
JD.com (JD) is forming a bullish ABCD harmonic pattern, with the current price advancing from point C toward the projected D completion zone. Based on the Fibonacci measurements, the AB=CD projection and 1.618 extension align near $56–57, suggesting a strong potential target area and confluence with the upper channel resistance.
A sustained move above $46.5 (B point) would confirm the continuation toward the D leg target. Momentum indicators are gradually turning positive, supporting the bullish bias in this setup.
Invalidation:
If price reverses and breaks below the C point, the ABCD harmonic structure would be invalidated, signaling potential weakness or a deeper retracement.
A sustained move above $46.5 (B point) would confirm the continuation toward the D leg target. Momentum indicators are gradually turning positive, supporting the bullish bias in this setup.
Invalidation:
If price reverses and breaks below the C point, the ABCD harmonic structure would be invalidated, signaling potential weakness or a deeper retracement.

Pernyataan Penyangkalan
Informasi dan publikasi ini tidak dimaksudkan, dan bukan merupakan, saran atau rekomendasi keuangan, investasi, trading, atau jenis lainnya yang diberikan atau didukung oleh TradingView. Baca selengkapnya di Ketentuan Penggunaan.
Pernyataan Penyangkalan
Informasi dan publikasi ini tidak dimaksudkan, dan bukan merupakan, saran atau rekomendasi keuangan, investasi, trading, atau jenis lainnya yang diberikan atau didukung oleh TradingView. Baca selengkapnya di Ketentuan Penggunaan.