What's up everyone, I'm back with some quick update on $JPM.
Quick fact: The 65-minute chart has 6 evenly sized candles (65 x 6 = 390, amt of mins per day).
Based on our previous analysis:
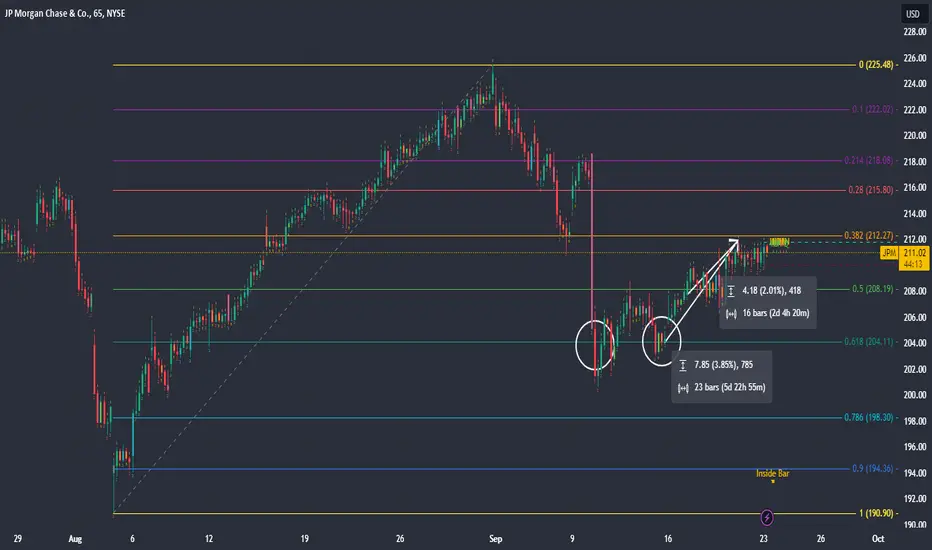
- JPM has bounced off the 0.618 bullish Fibonacci on the 65-minute chart at $204.11
- Price Target of $225.48 at 0.0 (assuming we continue the bullish trend)
- Stop Loss of $194.36 at the 0.9 bullish Fibonacci
The price is currently up 2% from when we first analyzed the stock and 3.85% from the last time it touched 0.618.
If you're in the play, stay the course, move your stop loss to 0.5 Fibonacci if you want to decrease your risk. If not, hold on.
I'm not in the play.
Quick fact: The 65-minute chart has 6 evenly sized candles (65 x 6 = 390, amt of mins per day).
Based on our previous analysis:
-
JPM has bounced off the 0.618 bullish Fibonacci on the 65-minute chart at $204.11- Price Target of $225.48 at 0.0 (assuming we continue the bullish trend)
- Stop Loss of $194.36 at the 0.9 bullish Fibonacci
The price is currently up 2% from when we first analyzed the stock and 3.85% from the last time it touched 0.618.
If you're in the play, stay the course, move your stop loss to 0.5 Fibonacci if you want to decrease your risk. If not, hold on.
I'm not in the play.

Publikasi terkait
Pernyataan Penyangkalan
Informasi dan publikasi ini tidak dimaksudkan, dan bukan merupakan, saran atau rekomendasi keuangan, investasi, trading, atau jenis lainnya yang diberikan atau didukung oleh TradingView. Baca selengkapnya di Ketentuan Penggunaan.
Publikasi terkait
Pernyataan Penyangkalan
Informasi dan publikasi ini tidak dimaksudkan, dan bukan merupakan, saran atau rekomendasi keuangan, investasi, trading, atau jenis lainnya yang diberikan atau didukung oleh TradingView. Baca selengkapnya di Ketentuan Penggunaan.