
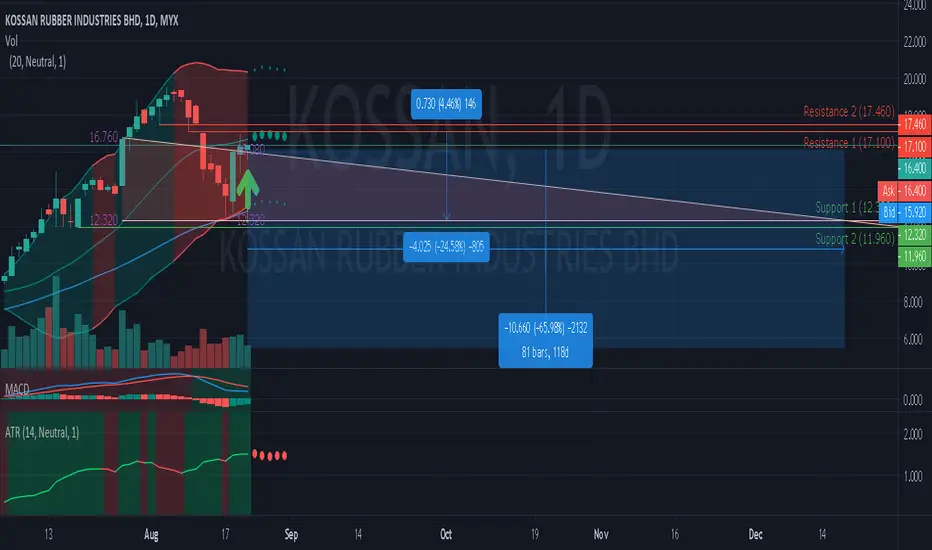
The support and resistance level of Kossan are 12.32 and 17.1 respectively.
It is observed that the MACD line of KOSSAN is above the centreline indicating some degree of strength in the price movement.
Resistance 1 : 17.1 (4.46%)
Resistance 2 : 17.46
Support 1 : 12.32 (-24.58%)
Support 2 : 11.96
Descending Triangle prediction at 21 Aug 2020.
Possible bearish price movement towards the resistance 12.32 within the next 118 days (81 bars : ETA 16 Dec 2020).
It is observed that the MACD line of KOSSAN is above the centreline indicating some degree of strength in the price movement.
Resistance 1 : 17.1 (4.46%)
Resistance 2 : 17.46
Support 1 : 12.32 (-24.58%)
Support 2 : 11.96
Descending Triangle prediction at 21 Aug 2020.
Possible bearish price movement towards the resistance 12.32 within the next 118 days (81 bars : ETA 16 Dec 2020).

Pernyataan Penyangkalan
Informasi dan publikasi ini tidak dimaksudkan, dan bukan merupakan, saran atau rekomendasi keuangan, investasi, trading, atau jenis lainnya yang diberikan atau didukung oleh TradingView. Baca selengkapnya di Ketentuan Penggunaan.
Pernyataan Penyangkalan
Informasi dan publikasi ini tidak dimaksudkan, dan bukan merupakan, saran atau rekomendasi keuangan, investasi, trading, atau jenis lainnya yang diberikan atau didukung oleh TradingView. Baca selengkapnya di Ketentuan Penggunaan.