
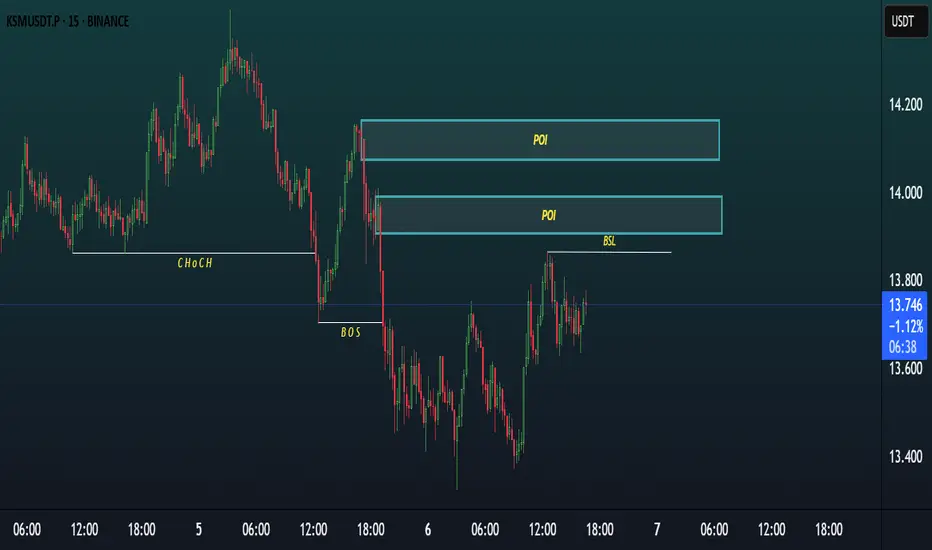
KSM/USDT – 15-Minute Chart Analysis
The market has shown a clear Change of Character (CHoCH), followed by a confirmed Break of Structure (BOS) to the downside, signaling a potential shift in market direction.
Currently, price is retracing and building liquidity below the Buy Side Liquidity (BSL) level.
Two well-defined Points of Interest (POIs) above serve as potential supply zones where smart money may look to execute sell orders.
A sweep of BSL followed by a rejection from either POI could offer a high-probability short entry, aligning with the bearish structure.
Maintain patience and wait for confirmation before execution.
The market has shown a clear Change of Character (CHoCH), followed by a confirmed Break of Structure (BOS) to the downside, signaling a potential shift in market direction.
Currently, price is retracing and building liquidity below the Buy Side Liquidity (BSL) level.
Two well-defined Points of Interest (POIs) above serve as potential supply zones where smart money may look to execute sell orders.
A sweep of BSL followed by a rejection from either POI could offer a high-probability short entry, aligning with the bearish structure.
Maintain patience and wait for confirmation before execution.

Pernyataan Penyangkalan
Informasi dan publikasi ini tidak dimaksudkan, dan bukan merupakan, saran atau rekomendasi keuangan, investasi, trading, atau jenis lainnya yang diberikan atau didukung oleh TradingView. Baca selengkapnya di Ketentuan Penggunaan.
Pernyataan Penyangkalan
Informasi dan publikasi ini tidak dimaksudkan, dan bukan merupakan, saran atau rekomendasi keuangan, investasi, trading, atau jenis lainnya yang diberikan atau didukung oleh TradingView. Baca selengkapnya di Ketentuan Penggunaan.