
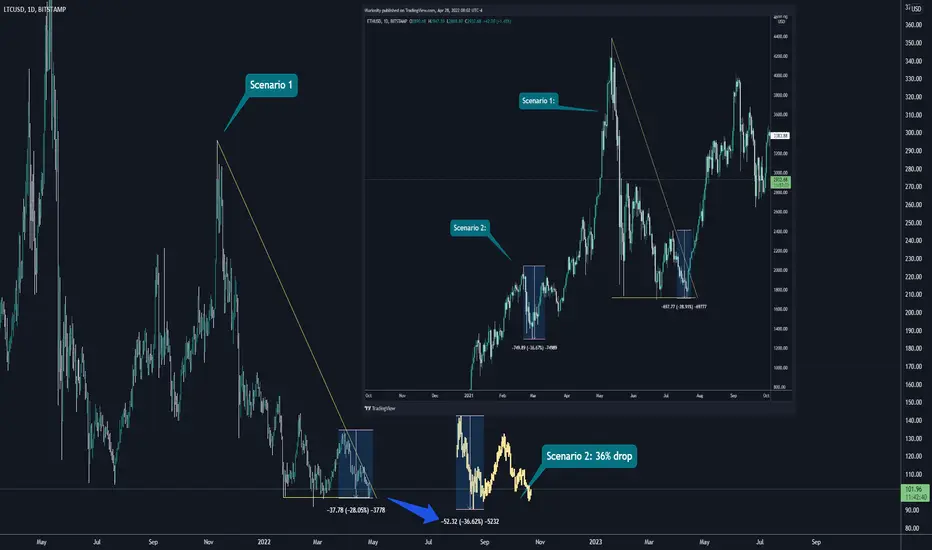
These are 2 possible scenarios with LTC that I managed to create with similar structure patterns found from ETH.
Scenario 1: was the first connection I found - where the trendline meets at the bottom 3 wicks at the bottom of the correction:
- the 28% drop towards the end of the trendline before liftoff
-same is shown with LTC currently
Scenario 2: was something else I found due to the similar patterns ETH had shown before its leg up:
- a 36% drop to its bottom before the leg up
- same can is shown with LTC currently
this isn't financial advice, just a chart full of hopium xD
Scenario 1: was the first connection I found - where the trendline meets at the bottom 3 wicks at the bottom of the correction:
- the 28% drop towards the end of the trendline before liftoff
-same is shown with LTC currently
Scenario 2: was something else I found due to the similar patterns ETH had shown before its leg up:
- a 36% drop to its bottom before the leg up
- same can is shown with LTC currently
this isn't financial advice, just a chart full of hopium xD

Pernyataan Penyangkalan
Informasi dan publikasi ini tidak dimaksudkan, dan bukan merupakan, saran atau rekomendasi keuangan, investasi, trading, atau jenis lainnya yang diberikan atau didukung oleh TradingView. Baca selengkapnya di Ketentuan Penggunaan.
Pernyataan Penyangkalan
Informasi dan publikasi ini tidak dimaksudkan, dan bukan merupakan, saran atau rekomendasi keuangan, investasi, trading, atau jenis lainnya yang diberikan atau didukung oleh TradingView. Baca selengkapnya di Ketentuan Penggunaan.