
🔎 Market Structure
The market is in a downtrend (a series of lower highs and lower lows).
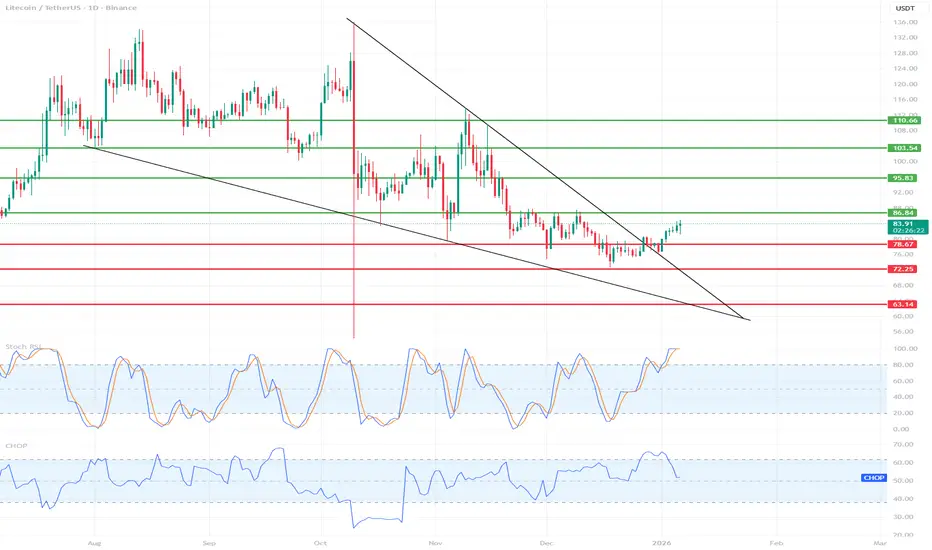
The price is moving within a descending channel (black lines).
The recent move is a rebound from the lower demand zones, but the trend has not yet been broken.
📉 Trend & Price Action
The main downtrend line has not been broken – the price has reached it and is reacting.
The current move looks like a pullback/upward correction, not a trend reversal.
No clear higher high → the structure remains bearish.
🟢 Key Levels
Resistance (sell zones)
86.84 USDT – local resistance (currently being tested)
95.83 USDT – strong structural resistance
103.54 USDT – previous downside base
110.66 USDT – very strong resistance (key to trend reversal)
Support (buy zones)
78.67 USDT – local support
72.25 USDT – strong demand zone
63.14 USDT – critical support (channel bottom)
📊 Indicators
Stochastic RSI
Currently in the overbought zone (>80)
Historically, on this chart, → often ends in a correction
Signal: watch out for shorts / profit-taking
CHOP Index
High → market was in consolidation
Recent CHOP breakout down → possible impulse but not yet confirmed by volume
🧠 Scenarios
🔴 Baseline scenario (more likely)
Rejection at 86–88 USDT
Return to around 78.67 → 72.25
Continuation of the downtrend
🟢 Alternative scenario (bullish, conditional)
Daily close above 95.83
Then a breakout of 103.54
Only 110.66 = a real trend change to up
🎯 Final conclusion
This is a correction in a downtrend, not a trend reversal.
Shorts are logical under resistance
Longs are only short-term/scalp
Swing longs only after a breakout of 103–110
The market is in a downtrend (a series of lower highs and lower lows).
The price is moving within a descending channel (black lines).
The recent move is a rebound from the lower demand zones, but the trend has not yet been broken.
📉 Trend & Price Action
The main downtrend line has not been broken – the price has reached it and is reacting.
The current move looks like a pullback/upward correction, not a trend reversal.
No clear higher high → the structure remains bearish.
🟢 Key Levels
Resistance (sell zones)
86.84 USDT – local resistance (currently being tested)
95.83 USDT – strong structural resistance
103.54 USDT – previous downside base
110.66 USDT – very strong resistance (key to trend reversal)
Support (buy zones)
78.67 USDT – local support
72.25 USDT – strong demand zone
63.14 USDT – critical support (channel bottom)
📊 Indicators
Stochastic RSI
Currently in the overbought zone (>80)
Historically, on this chart, → often ends in a correction
Signal: watch out for shorts / profit-taking
CHOP Index
High → market was in consolidation
Recent CHOP breakout down → possible impulse but not yet confirmed by volume
🧠 Scenarios
🔴 Baseline scenario (more likely)
Rejection at 86–88 USDT
Return to around 78.67 → 72.25
Continuation of the downtrend
🟢 Alternative scenario (bullish, conditional)
Daily close above 95.83
Then a breakout of 103.54
Only 110.66 = a real trend change to up
🎯 Final conclusion
This is a correction in a downtrend, not a trend reversal.
Shorts are logical under resistance
Longs are only short-term/scalp
Swing longs only after a breakout of 103–110

Pernyataan Penyangkalan
Informasi dan publikasi ini tidak dimaksudkan, dan bukan merupakan, saran atau rekomendasi keuangan, investasi, trading, atau jenis lainnya yang diberikan atau didukung oleh TradingView. Baca selengkapnya di Ketentuan Penggunaan.
Pernyataan Penyangkalan
Informasi dan publikasi ini tidak dimaksudkan, dan bukan merupakan, saran atau rekomendasi keuangan, investasi, trading, atau jenis lainnya yang diberikan atau didukung oleh TradingView. Baca selengkapnya di Ketentuan Penggunaan.