
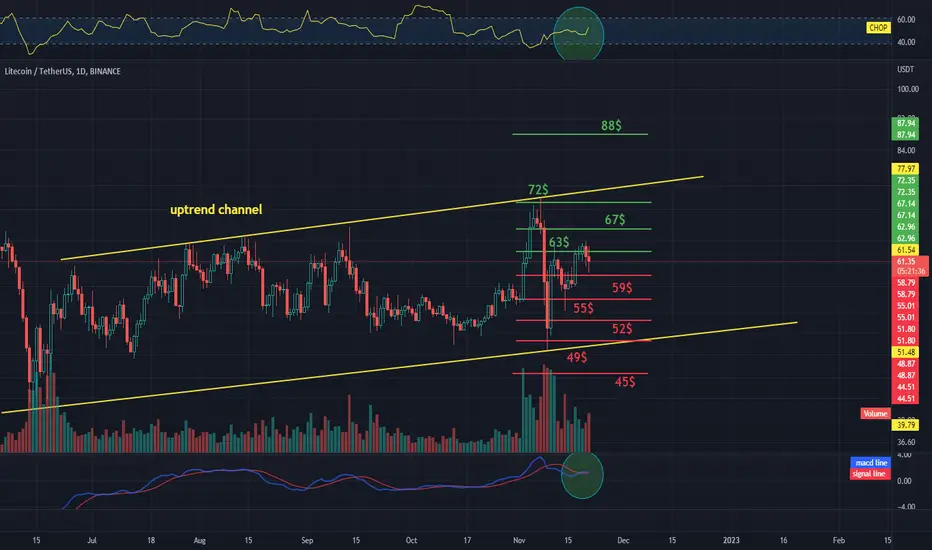
Hello everyone, I invite you to review the LTCUSDT chart, taking into account the one-day interval, we can see that the price does not record large drops despite the low stability of BTC. The yellow lines mark the uptrend channel.
Looking at the support levels, we can define several levels, first we can define support at $59, then $55, $52, $49, and $45.
Looking the other way, we see first resistance at $63, second at $67, third at $72, and fourth at $88.
Please pay attention to the CHOP index, which indicates that we are gaining more and more energy, the MACD indicator indicates an uptrend, but the volume, although not large, indicates the advantage of sellers.
Looking at the support levels, we can define several levels, first we can define support at $59, then $55, $52, $49, and $45.
Looking the other way, we see first resistance at $63, second at $67, third at $72, and fourth at $88.
Please pay attention to the CHOP index, which indicates that we are gaining more and more energy, the MACD indicator indicates an uptrend, but the volume, although not large, indicates the advantage of sellers.

Pernyataan Penyangkalan
Informasi dan publikasi ini tidak dimaksudkan, dan bukan merupakan, saran atau rekomendasi keuangan, investasi, trading, atau jenis lainnya yang diberikan atau didukung oleh TradingView. Baca selengkapnya di Ketentuan Penggunaan.
Pernyataan Penyangkalan
Informasi dan publikasi ini tidak dimaksudkan, dan bukan merupakan, saran atau rekomendasi keuangan, investasi, trading, atau jenis lainnya yang diberikan atau didukung oleh TradingView. Baca selengkapnya di Ketentuan Penggunaan.