
Litecoin (LTC) technical analysis:
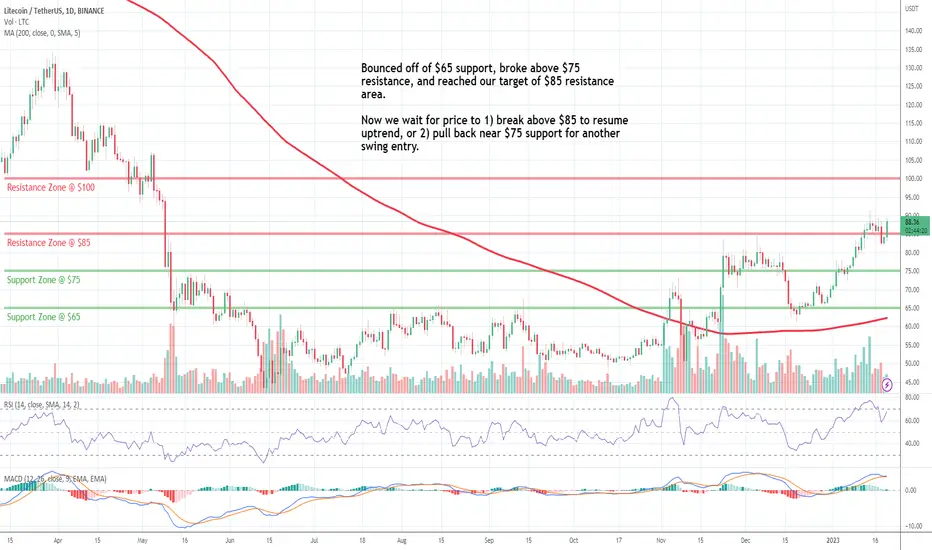
Trade setup: Price remains in an Uptrend and is up 30% since our trading video on LTC was published on Dec 18. After bouncing off of $65 support, it broke above $75 resistance and reached our target of $85 resistance area. That’s where it got rejected a couple of times in Nov/Dec as traders took profits. Now we wait for price to 1) break above $85 to resume uptrend, or 2) pull back near $75 support for another swing entry.
Trend: Uptrend across all time horizons (Short- Medium- and Long-Term).
Momentum is Mixed as MACD Line is below MACD Signal Line (Bearish) but RSI > 55 (Bullish).
Support and Resistance: Nearest Support Zone is $75, (previous resistance), then $65. The nearest Resistance Zone is $85, then $100.
Trade setup: Price remains in an Uptrend and is up 30% since our trading video on LTC was published on Dec 18. After bouncing off of $65 support, it broke above $75 resistance and reached our target of $85 resistance area. That’s where it got rejected a couple of times in Nov/Dec as traders took profits. Now we wait for price to 1) break above $85 to resume uptrend, or 2) pull back near $75 support for another swing entry.
Trend: Uptrend across all time horizons (Short- Medium- and Long-Term).
Momentum is Mixed as MACD Line is below MACD Signal Line (Bearish) but RSI > 55 (Bullish).
Support and Resistance: Nearest Support Zone is $75, (previous resistance), then $65. The nearest Resistance Zone is $85, then $100.

Pernyataan Penyangkalan
Informasi dan publikasi ini tidak dimaksudkan, dan bukan merupakan, saran atau rekomendasi keuangan, investasi, trading, atau jenis lainnya yang diberikan atau didukung oleh TradingView. Baca selengkapnya di Ketentuan Penggunaan.
Pernyataan Penyangkalan
Informasi dan publikasi ini tidak dimaksudkan, dan bukan merupakan, saran atau rekomendasi keuangan, investasi, trading, atau jenis lainnya yang diberikan atau didukung oleh TradingView. Baca selengkapnya di Ketentuan Penggunaan.