
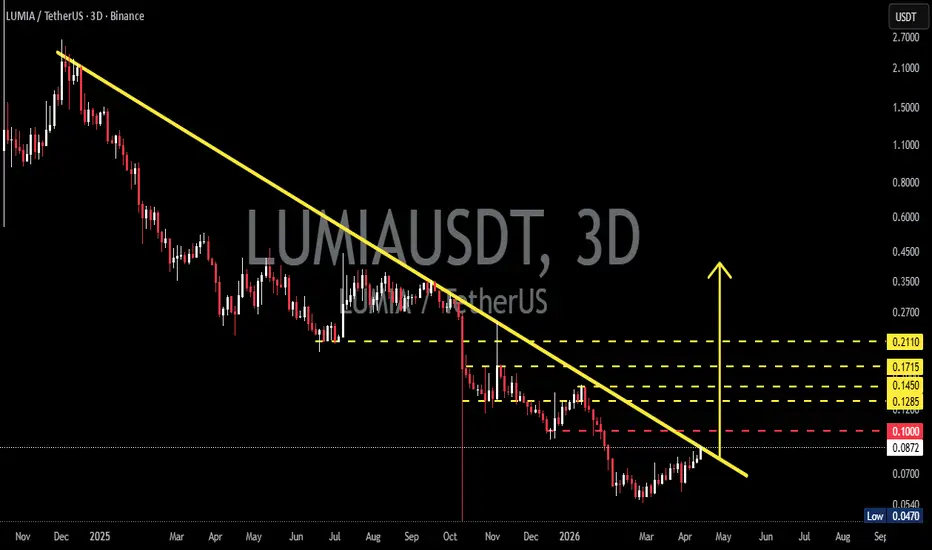
On the 3D timeframe, LUMIA/USDT is still within a strong downtrend structure, characterized by:
Consistent Lower Highs & Lower Lows
A descending trendline (yellow) acting as dynamic resistance
A sharp drop in October reinforcing bearish pressure
However, the current price action shows:
Price approaching the end of the trendline
Signs of a potential breakout
Formation of a base around the lower zone (0.05 – 0.08)
---
Structure & Patterns Identified
1. Descending Triangle / Falling Resistance
The yellow trendline represents descending resistance
Price has been consistently rejected from above
Typically a bearish continuation pattern, but can become an early reversal signal if a strong breakout occurs
2. Base Accumulation (Potential Bottoming)
After a sharp decline, price is moving sideways
Forming a strong support zone at the lows (0.047 – 0.06)
This may indicate accumulation by smart money
3. Breakout Setup
Price is currently testing the descending trendline
A breakout would confirm a potential market structure shift
---
Key Levels
Strong support: 0.047 – 0.060
Current demand zone: 0.070 – 0.090
Nearest resistance: 0.100
Next resistance / targets:
0.1285
0.1450
0.1715
0.2110
---
Bullish Scenario 🚀
Bullish confirmation occurs if:
1. Price breaks and closes above the descending trendline
2. Successfully breaks 0.100 resistance
3. Holds above it during a retest
Upside targets:
0.1285 (TP1)
0.1450 (TP2)
0.1715 (TP3)
0.2110 (TP4)
💡 This would indicate:
A shift from downtrend → uptrend
Potential mid-term reversal
---
Bearish Scenario 📉
Bearish momentum remains dominant if:
1. Price fails to break the trendline
2. Strong rejection occurs around 0.09 – 0.10
3. Price breaks back below 0.070
Downside targets:
0.060
0.047 (previous low)
💡 This suggests:
Downtrend remains intact
The breakout attempt is a fakeout / liquidity grab
---
Conclusion
LUMIA/USDT is at a critical decision zone — between:
Continuation of the downtrend
or
The beginning of a major reversal
The next move depends heavily on: 👉 Price reaction to the trendline and the 0.100 level
#LUMIAUSDT #CryptoAnalysis #TechnicalAnalysis #Altcoin #BreakoutSetup #TrendlineBreak #CryptoTrading #BullishScenario #BearishScenario #SmartMoney #Altcoins #MarketStructure
Consistent Lower Highs & Lower Lows
A descending trendline (yellow) acting as dynamic resistance
A sharp drop in October reinforcing bearish pressure
However, the current price action shows:
Price approaching the end of the trendline
Signs of a potential breakout
Formation of a base around the lower zone (0.05 – 0.08)
---
Structure & Patterns Identified
1. Descending Triangle / Falling Resistance
The yellow trendline represents descending resistance
Price has been consistently rejected from above
Typically a bearish continuation pattern, but can become an early reversal signal if a strong breakout occurs
2. Base Accumulation (Potential Bottoming)
After a sharp decline, price is moving sideways
Forming a strong support zone at the lows (0.047 – 0.06)
This may indicate accumulation by smart money
3. Breakout Setup
Price is currently testing the descending trendline
A breakout would confirm a potential market structure shift
---
Key Levels
Strong support: 0.047 – 0.060
Current demand zone: 0.070 – 0.090
Nearest resistance: 0.100
Next resistance / targets:
0.1285
0.1450
0.1715
0.2110
---
Bullish Scenario 🚀
Bullish confirmation occurs if:
1. Price breaks and closes above the descending trendline
2. Successfully breaks 0.100 resistance
3. Holds above it during a retest
Upside targets:
0.1285 (TP1)
0.1450 (TP2)
0.1715 (TP3)
0.2110 (TP4)
💡 This would indicate:
A shift from downtrend → uptrend
Potential mid-term reversal
---
Bearish Scenario 📉
Bearish momentum remains dominant if:
1. Price fails to break the trendline
2. Strong rejection occurs around 0.09 – 0.10
3. Price breaks back below 0.070
Downside targets:
0.060
0.047 (previous low)
💡 This suggests:
Downtrend remains intact
The breakout attempt is a fakeout / liquidity grab
---
Conclusion
LUMIA/USDT is at a critical decision zone — between:
Continuation of the downtrend
or
The beginning of a major reversal
The next move depends heavily on: 👉 Price reaction to the trendline and the 0.100 level
#LUMIAUSDT #CryptoAnalysis #TechnicalAnalysis #Altcoin #BreakoutSetup #TrendlineBreak #CryptoTrading #BullishScenario #BearishScenario #SmartMoney #Altcoins #MarketStructure

✅ Get Free Signals! Join Our Telegram Channel Here: t.me/TheCryptoNuclear
✅ Twitter: twitter.com/crypto_nuclear
✅ Join Bybit : partner.bybit.com/b/nuclearvip
✅ Benefits : Lifetime Trading Fee Discount -50%
✅ Twitter: twitter.com/crypto_nuclear
✅ Join Bybit : partner.bybit.com/b/nuclearvip
✅ Benefits : Lifetime Trading Fee Discount -50%
Pernyataan Penyangkalan
Informasi dan publikasi ini tidak dimaksudkan, dan bukan merupakan, saran atau rekomendasi keuangan, investasi, trading, atau jenis lainnya yang diberikan atau didukung oleh TradingView. Baca selengkapnya di Ketentuan Penggunaan.
✅ Get Free Signals! Join Our Telegram Channel Here: t.me/TheCryptoNuclear
✅ Twitter: twitter.com/crypto_nuclear
✅ Join Bybit : partner.bybit.com/b/nuclearvip
✅ Benefits : Lifetime Trading Fee Discount -50%
✅ Twitter: twitter.com/crypto_nuclear
✅ Join Bybit : partner.bybit.com/b/nuclearvip
✅ Benefits : Lifetime Trading Fee Discount -50%
Pernyataan Penyangkalan
Informasi dan publikasi ini tidak dimaksudkan, dan bukan merupakan, saran atau rekomendasi keuangan, investasi, trading, atau jenis lainnya yang diberikan atau didukung oleh TradingView. Baca selengkapnya di Ketentuan Penggunaan.