MATICUSDT market structure
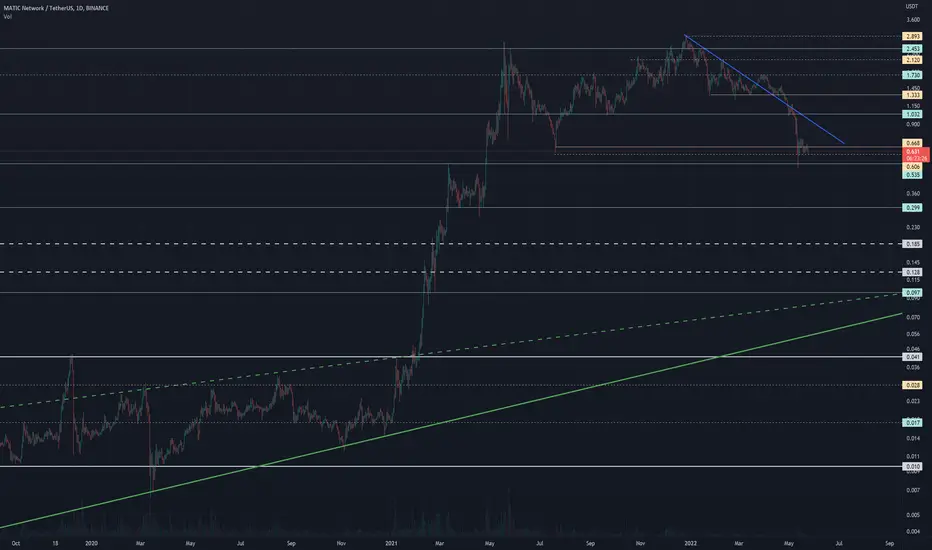
Strong levels represented by solid lines.
Less significant levels represented by dashed lines.
Trendlines represented by slanted lines.
More often than not, price action is choppy with much overlap between candles. Strictly following definitions for swing high/low could leave us with a market structure that is just unworkable. Our intent is simply to identify those key turning points which stand out on the chart as the most obvious levels, and therefore offer potential barriers to future price action.

Pernyataan Penyangkalan
Informasi dan publikasi ini tidak dimaksudkan, dan bukan merupakan, saran atau rekomendasi keuangan, investasi, trading, atau jenis lainnya yang diberikan atau didukung oleh TradingView. Baca selengkapnya di Ketentuan Penggunaan.
Pernyataan Penyangkalan
Informasi dan publikasi ini tidak dimaksudkan, dan bukan merupakan, saran atau rekomendasi keuangan, investasi, trading, atau jenis lainnya yang diberikan atau didukung oleh TradingView. Baca selengkapnya di Ketentuan Penggunaan.