
Hey there how you doing guys?
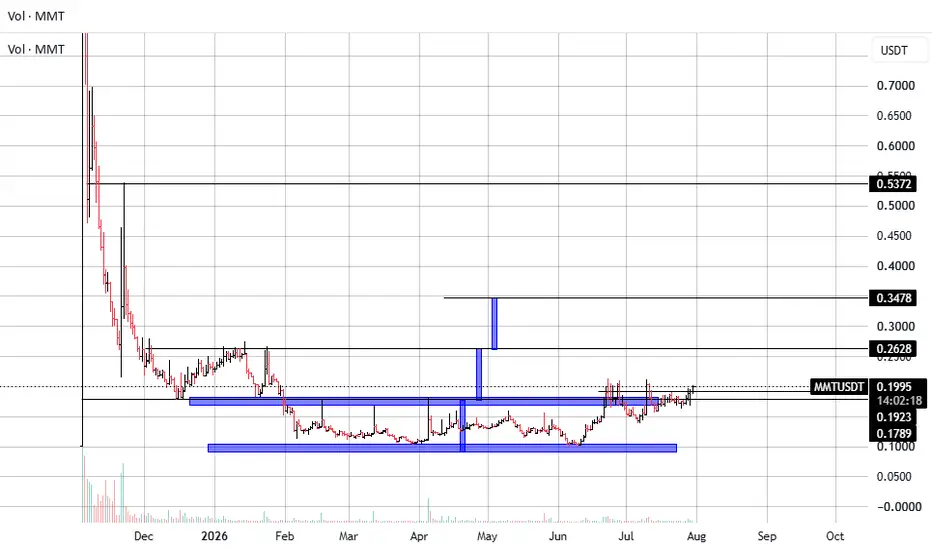
MMT is showing a long-term accumulation structure after a prolonged decline from its initial listing highs. The chart suggests that the market has been building a broad base between approximately $0.10 and $0.20, with price now attempting to establish itself above the upper boundary of that range.
The recent price action is particularly interesting because MMT has reclaimed the $0.19–0.20 resistance area and is currently consolidating around $0.20. This is an important structural level: holding it would transform the previous resistance into potential support.
Key Technical Levels:
Major support: ~$0.10–0.12
Primary breakout zone: ~$0.19–0.20
Current price: ~$0.20
Target 1: ~$0.263
Target 2: ~$0.348
Major macro target: ~$0.537
Bullish Scenario
The key confirmation is a sustained breakout and acceptance above $0.20.
If MMT can hold this area and build a new higher-low structure above it, the chart opens a relatively clear path toward $0.263. A decisive break above that level would then expose $0.348, followed by the major resistance around $0.537.
The projected structure is particularly interesting because the targets are not random extensions: they correspond to significant historical price areas and previous structural levels.
Market Structure
Long-term downtrend appears to have transitioned into base formation / accumulation.
The $0.10–0.12 zone has acted as strong structural support.
Price has repeatedly tested the $0.19–0.20 area, making this the key level to monitor.
A successful breakout would establish a new higher-high relative to the entire accumulation structure.
The large historical volume spike shows that MMT experienced significant initial market participation, while the subsequent decline created a long period of price discovery and consolidation.
What I Would Watch
The most important thing now is not simply the move above $0.20, but whether MMT can hold it.
A clean breakout → consolidation above $0.20 → continuation would be the strongest setup.
Conversely, a rejection followed by a loss of $0.19/$0.20 would suggest that the breakout has not yet been fully confirmed and could send price back toward the lower part of the range.
Overall: MMT is at a potentially important inflection point. If the $0.20 area becomes support, the chart offers a clear technical roadmap toward $0.263 → $0.348 → $0.537, representing a transition from a long accumulation phase into a potential new expansion cycle.
have an amazing trading day!!
MMT is showing a long-term accumulation structure after a prolonged decline from its initial listing highs. The chart suggests that the market has been building a broad base between approximately $0.10 and $0.20, with price now attempting to establish itself above the upper boundary of that range.
The recent price action is particularly interesting because MMT has reclaimed the $0.19–0.20 resistance area and is currently consolidating around $0.20. This is an important structural level: holding it would transform the previous resistance into potential support.
Key Technical Levels:
Major support: ~$0.10–0.12
Primary breakout zone: ~$0.19–0.20
Current price: ~$0.20
Target 1: ~$0.263
Target 2: ~$0.348
Major macro target: ~$0.537
Bullish Scenario
The key confirmation is a sustained breakout and acceptance above $0.20.
If MMT can hold this area and build a new higher-low structure above it, the chart opens a relatively clear path toward $0.263. A decisive break above that level would then expose $0.348, followed by the major resistance around $0.537.
The projected structure is particularly interesting because the targets are not random extensions: they correspond to significant historical price areas and previous structural levels.
Market Structure
Long-term downtrend appears to have transitioned into base formation / accumulation.
The $0.10–0.12 zone has acted as strong structural support.
Price has repeatedly tested the $0.19–0.20 area, making this the key level to monitor.
A successful breakout would establish a new higher-high relative to the entire accumulation structure.
The large historical volume spike shows that MMT experienced significant initial market participation, while the subsequent decline created a long period of price discovery and consolidation.
What I Would Watch
The most important thing now is not simply the move above $0.20, but whether MMT can hold it.
A clean breakout → consolidation above $0.20 → continuation would be the strongest setup.
Conversely, a rejection followed by a loss of $0.19/$0.20 would suggest that the breakout has not yet been fully confirmed and could send price back toward the lower part of the range.
Overall: MMT is at a potentially important inflection point. If the $0.20 area becomes support, the chart offers a clear technical roadmap toward $0.263 → $0.348 → $0.537, representing a transition from a long accumulation phase into a potential new expansion cycle.
have an amazing trading day!!
Catatan
Still going amazing this trade, good levels are reached. :-D
Who Dares always Wins!
My contact on Telegram: @Etelve
My contact on Telegram: @Etelve
Pernyataan Penyangkalan
Informasi dan publikasi ini tidak dimaksudkan, dan bukan merupakan, saran atau rekomendasi keuangan, investasi, trading, atau jenis lainnya yang diberikan atau didukung oleh TradingView. Baca selengkapnya di Ketentuan Penggunaan.
Who Dares always Wins!
My contact on Telegram: @Etelve
My contact on Telegram: @Etelve
Pernyataan Penyangkalan
Informasi dan publikasi ini tidak dimaksudkan, dan bukan merupakan, saran atau rekomendasi keuangan, investasi, trading, atau jenis lainnya yang diberikan atau didukung oleh TradingView. Baca selengkapnya di Ketentuan Penggunaan.