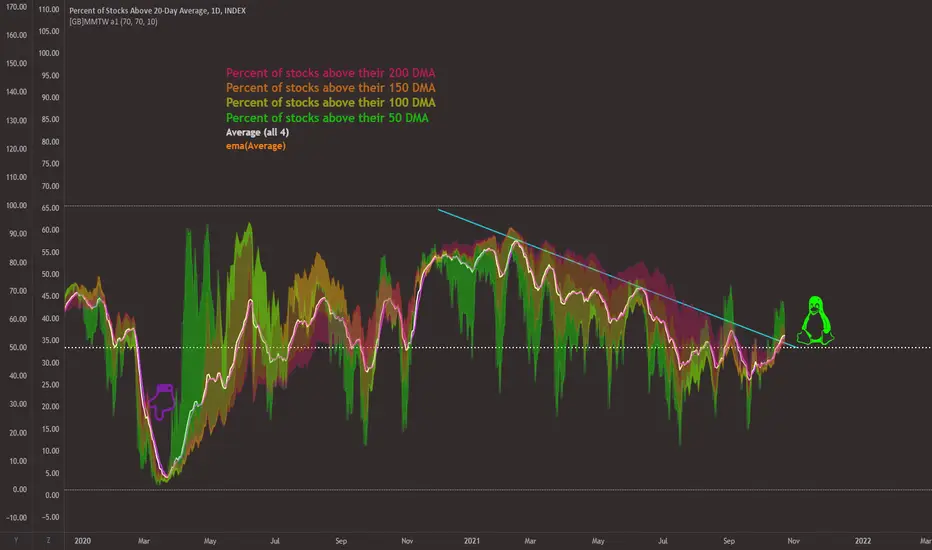
The daily chart is showing market sentiment from a breadth perspective: the percentage of stocks on the NYSE (2943 stocks) that are above their daily moving averages.
The trend is increasingly bullish but that increase has peaked in recent days.
[bDetail:
Average of all 4 - WHITE line
EMA10 of the white line - ORANGE line
All 4 indicators and their mean are above the midline with positive momentum .
That momentum has peaked in recent days and is no longer accelerating.
The trend is increasingly bullish but that increase has peaked in recent days.
[bDetail:
- MMTH - RED - Percentage of stocks above their 200 DMA
MMOF - Percentage of stocks above their 150 DMA
MMOH - Percentage of stocks above their 100 DMA
MMFI - GREEN - Percentage of stocks above their 50 DMA
Average of all 4 - WHITE line
EMA10 of the white line - ORANGE line
All 4 indicators and their mean are above the midline with positive momentum .
That momentum has peaked in recent days and is no longer accelerating.

Pernyataan Penyangkalan
Informasi dan publikasi ini tidak dimaksudkan, dan bukan merupakan, saran atau rekomendasi keuangan, investasi, trading, atau jenis lainnya yang diberikan atau didukung oleh TradingView. Baca selengkapnya di Ketentuan Penggunaan.
Pernyataan Penyangkalan
Informasi dan publikasi ini tidak dimaksudkan, dan bukan merupakan, saran atau rekomendasi keuangan, investasi, trading, atau jenis lainnya yang diberikan atau didukung oleh TradingView. Baca selengkapnya di Ketentuan Penggunaan.