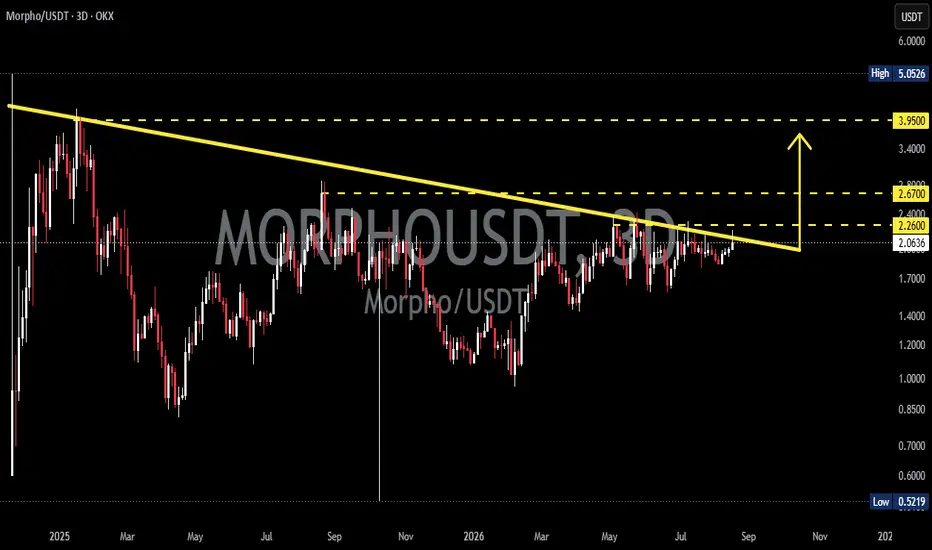
📊 Technical Analysis
💵 Coin: MORPHO / USDT
⌛ Time Frame: 3D
📉 Pattern: Long-Term Descending Trendline / Compression
💰 Current Area: ~$2.05
🎯 Key Resistance: $2.26 – $2.67
🔥 Major Target: $3.95
📈 Major High: ~$5.05
---
📉 Pattern & Market Structure
MORPHO is currently approaching a major long-term Descending Trendline that has been controlling the broader bearish structure since the previous major highs.
🔸 This descending trendline has repeatedly acted as dynamic resistance, preventing price from establishing a sustained bullish expansion.
🔸 At the same time, recent price action showsMORPHO consolidating around the $1.70 – $2.10 region, while gradually pressing against the descending resistance.
🔸 This creates an important price compression structure. As price continues to test the trendline, a decisive breakout could potentially trigger a significant expansion in volatility.
⚠️ However, the breakout has not yet been clearly confirmed. The trendline remains the primary technical barrier that bulls need to overcome.
---
🟢 Bullish Scenario
The bullish scenario becomes significantly stronger ifMORPHO manages to produce a convincing 3D candle close above the descending trendline.
🚀 A confirmed breakout could indicate that the long-term bearish pressure is beginning to weaken.
🎯 The first important resistance is located around $2.26.
📈 If $2.26 is reclaimed and successfully converted into support, the next major resistance sits around $2.67.
🔥 A clean breakout above $2.67 could open the way toward the larger $3.95 resistance/target zone shown on the chart.
💥 Reaching $3.95 would represent a substantial recovery from the current ~$2.05 area and would confirm a much stronger change in the medium-to-long-term market structure.
---
🔴 Bearish Scenario
The descending trendline is still active resistance until proven otherwise.
📉 IfMORPHO gets rejected again from this trendline and fails to reclaim $2.26, sellers could regain control.
⚠️ A rejection could push price back toward the recent consolidation/support region around $1.70 – $1.80.
🔻 Losing that area would weaken the current recovery structure and increase the probability of a deeper retracement toward previous lower support zones.
Therefore, traders should avoid treating a simple wick above the trendline as confirmation. A strong candle close and sustained price action above resistance would provide much better confirmation.
---
🔑 Key Levels to Watch
🟡 $2.26 → First breakout confirmation / resistance
🟡 $2.67 → Major resistance and continuation level
🟡 $3.95 → Major bullish target / resistance
🔵 $5.05 → Previous major high area
---
🧠 Conclusion
MORPHO is currently sitting at a critical technical decision point.
The long-term descending trendline remains the most important structure on this chart. Price is gradually compressing underneath it, meaning a decisive move could potentially occur once this structure is broken.
🟢 Breakout + 3D close above the trendline → bullish structure begins to strengthen.
🚀 Breakout above $2.26 → increases probability of continuation toward $2.67.
🔥 Breakout above $2.67 → could unlock a much larger move toward the $3.95 major resistance zone.
🔴 Trendline rejection → keeps the broader bearish structure intact and could send price back toward lower support.
👀 The key is confirmation. The trendline breakout could become the trigger for MORPHO's next major directional move.
#MORPHO #MORPHOUSDT #Crypto #CryptoTrading #TechnicalAnalysis #Altcoins #Altcoin #Breakout #Bullish #CryptoAnalysis #PriceAction #Trendline
💵 Coin:
MORPHO / USDT⌛ Time Frame: 3D
📉 Pattern: Long-Term Descending Trendline / Compression
💰 Current Area: ~$2.05
🎯 Key Resistance: $2.26 – $2.67
🔥 Major Target: $3.95
📈 Major High: ~$5.05
---
📉 Pattern & Market Structure
MORPHO is currently approaching a major long-term Descending Trendline that has been controlling the broader bearish structure since the previous major highs.🔸 This descending trendline has repeatedly acted as dynamic resistance, preventing price from establishing a sustained bullish expansion.
🔸 At the same time, recent price action shows
MORPHO consolidating around the $1.70 – $2.10 region, while gradually pressing against the descending resistance.🔸 This creates an important price compression structure. As price continues to test the trendline, a decisive breakout could potentially trigger a significant expansion in volatility.
⚠️ However, the breakout has not yet been clearly confirmed. The trendline remains the primary technical barrier that bulls need to overcome.
---
🟢 Bullish Scenario
The bullish scenario becomes significantly stronger if
MORPHO manages to produce a convincing 3D candle close above the descending trendline.🚀 A confirmed breakout could indicate that the long-term bearish pressure is beginning to weaken.
🎯 The first important resistance is located around $2.26.
📈 If $2.26 is reclaimed and successfully converted into support, the next major resistance sits around $2.67.
🔥 A clean breakout above $2.67 could open the way toward the larger $3.95 resistance/target zone shown on the chart.
💥 Reaching $3.95 would represent a substantial recovery from the current ~$2.05 area and would confirm a much stronger change in the medium-to-long-term market structure.
---
🔴 Bearish Scenario
The descending trendline is still active resistance until proven otherwise.
📉 If
MORPHO gets rejected again from this trendline and fails to reclaim $2.26, sellers could regain control.⚠️ A rejection could push price back toward the recent consolidation/support region around $1.70 – $1.80.
🔻 Losing that area would weaken the current recovery structure and increase the probability of a deeper retracement toward previous lower support zones.
Therefore, traders should avoid treating a simple wick above the trendline as confirmation. A strong candle close and sustained price action above resistance would provide much better confirmation.
---
🔑 Key Levels to Watch
🟡 $2.26 → First breakout confirmation / resistance
🟡 $2.67 → Major resistance and continuation level
🟡 $3.95 → Major bullish target / resistance
🔵 $5.05 → Previous major high area
---
🧠 Conclusion
MORPHO is currently sitting at a critical technical decision point.The long-term descending trendline remains the most important structure on this chart. Price is gradually compressing underneath it, meaning a decisive move could potentially occur once this structure is broken.
🟢 Breakout + 3D close above the trendline → bullish structure begins to strengthen.
🚀 Breakout above $2.26 → increases probability of continuation toward $2.67.
🔥 Breakout above $2.67 → could unlock a much larger move toward the $3.95 major resistance zone.
🔴 Trendline rejection → keeps the broader bearish structure intact and could send price back toward lower support.
👀 The key is confirmation. The trendline breakout could become the trigger for MORPHO's next major directional move.
#MORPHO #MORPHOUSDT #Crypto #CryptoTrading #TechnicalAnalysis #Altcoins #Altcoin #Breakout #Bullish #CryptoAnalysis #PriceAction #Trendline

✅ Get Free Signals! Join Our Telegram Channel Here: t.me/TheCryptoNuclear
✅ Twitter: twitter.com/crypto_nuclear
✅ Join Bybit : partner.bybit.com/b/nuclearvip
✅ Benefits : Lifetime Trading Fee Discount -50%
✅ Twitter: twitter.com/crypto_nuclear
✅ Join Bybit : partner.bybit.com/b/nuclearvip
✅ Benefits : Lifetime Trading Fee Discount -50%
Pernyataan Penyangkalan
Informasi dan publikasi ini tidak dimaksudkan, dan bukan merupakan, saran atau rekomendasi keuangan, investasi, trading, atau jenis lainnya yang diberikan atau didukung oleh TradingView. Baca selengkapnya di Ketentuan Penggunaan.
✅ Get Free Signals! Join Our Telegram Channel Here: t.me/TheCryptoNuclear
✅ Twitter: twitter.com/crypto_nuclear
✅ Join Bybit : partner.bybit.com/b/nuclearvip
✅ Benefits : Lifetime Trading Fee Discount -50%
✅ Twitter: twitter.com/crypto_nuclear
✅ Join Bybit : partner.bybit.com/b/nuclearvip
✅ Benefits : Lifetime Trading Fee Discount -50%
Pernyataan Penyangkalan
Informasi dan publikasi ini tidak dimaksudkan, dan bukan merupakan, saran atau rekomendasi keuangan, investasi, trading, atau jenis lainnya yang diberikan atau didukung oleh TradingView. Baca selengkapnya di Ketentuan Penggunaan.