
Hey guys,
Yearly chart: Bullish Eng.
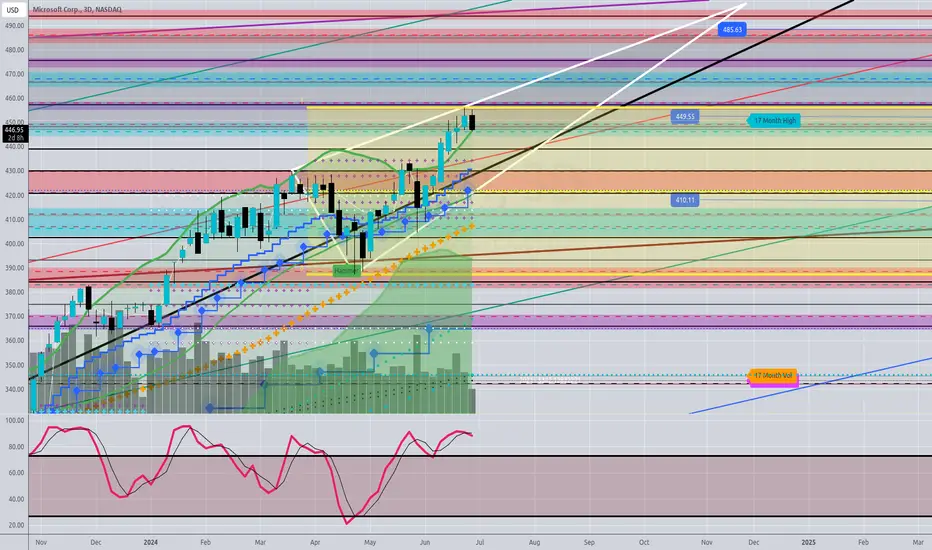
--> Strong Resistance at 449 and 522
--> This is the first point where some Profit taking could come.
Quarterly: Bullish - although gains are weak compared to the months before.
Monthly: Bullish Candle
--> Stochastic bearish Divergence
--> Bullish Trendline intact
3D: Ascending Triangle Formation
--> break above would be extremely bullish because Bears are meant to take over.
Target Bulls: 485 - 582
Target bears: 410 - 388
Thanks for reading…
Yearly chart: Bullish Eng.
--> Strong Resistance at 449 and 522
--> This is the first point where some Profit taking could come.
Quarterly: Bullish - although gains are weak compared to the months before.
Monthly: Bullish Candle
--> Stochastic bearish Divergence
--> Bullish Trendline intact
3D: Ascending Triangle Formation
--> break above would be extremely bullish because Bears are meant to take over.
Target Bulls: 485 - 582
Target bears: 410 - 388
Thanks for reading…

Publikasi terkait
Pernyataan Penyangkalan
Informasi dan publikasi ini tidak dimaksudkan, dan bukan merupakan, saran atau rekomendasi keuangan, investasi, trading, atau jenis lainnya yang diberikan atau didukung oleh TradingView. Baca selengkapnya di Ketentuan Penggunaan.
Publikasi terkait
Pernyataan Penyangkalan
Informasi dan publikasi ini tidak dimaksudkan, dan bukan merupakan, saran atau rekomendasi keuangan, investasi, trading, atau jenis lainnya yang diberikan atau didukung oleh TradingView. Baca selengkapnya di Ketentuan Penggunaan.